
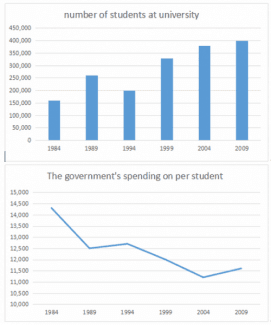
The bar chart gives the magnitude of the number of university students in a particular country and how much the government spent on each student various 1984 to 2009.From the graph that there are differences in the following years to different years.
The capacity of 1984 was lower than that of 1989 (150000% and 250000%) respectively. The
percent
Replace the word
percentage
of
1994 Change preposition
in
lower
than that of 1999 (20000% and 350000%) respectively.The scale of 2004 Add a missing verb
was lower
lower
than that of 2009 (360000% and 400000%). The rate Add a missing verb
was lower
of
2009 was 400000%, which was the largest in 2004. The share of 1984 was the lowest at 150000 Change preposition
in
than
that Replace the word
then
2009
.
Change preposition
in 2009
overall
,the percentage of 2009 reached Linking Words
the
peak at 400000% Correct article usage
a
in
1999 to 2004Change preposition
from