
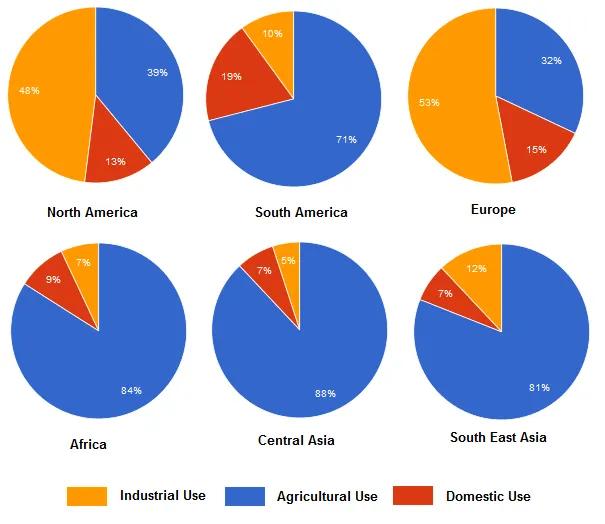
The pie charts illustrate the proportion of the amount of using
water
for Use synonyms
different
Add an article
a different
reason
in six different Fix the agreement mistake
reasons
countries
.
Use synonyms
Overall
, most of the Linking Words
countries
used Use synonyms
water
for Use synonyms
agricultural
Replace the word
agriculture
whereas
Linking Words
in
North America and Europe used it for industry the most.
In North America, 48% of Change preposition
apply
water
was used for industry.Use synonyms
This
is followed by the figure forLinking Words
agricutural
Correct your spelling
agricultural
usage
(39%) and domestic Use synonyms
usage
(13%) . Use synonyms
Similary
, in Europe, the proportion of using Correct your spelling
Similarly
water
for Use synonyms
indusry
was 53% which Correct your spelling
industry
consitst
the most of the pie chart. Correct your spelling
consist
consists
On the other hand
, the percentage of Linking Words
agriculture
Replace the word
agricultural
usage
and domestic Use synonyms
usage
Use synonyms
were
32% and 18% Change the verb form
was
respectivaly
.
Correct your spelling
respectively
However
, other Linking Words
countries
were different from these two Use synonyms
countries
. Using Use synonyms
water
for Use synonyms
agricultureIn
in South East Asia and Central Asia, Africa made up more than 80% which was the most of the pie chart. South Africa Correct your spelling
agriculture
also
shows Linking Words
high
percentage of using Add an article
a high
water
for Agriculture (70%)Use synonyms