The charts below show the percentage of water used for different purposes in six areas of the world.

The charts below show the percentage of water used for different purposes in six areas of the world.
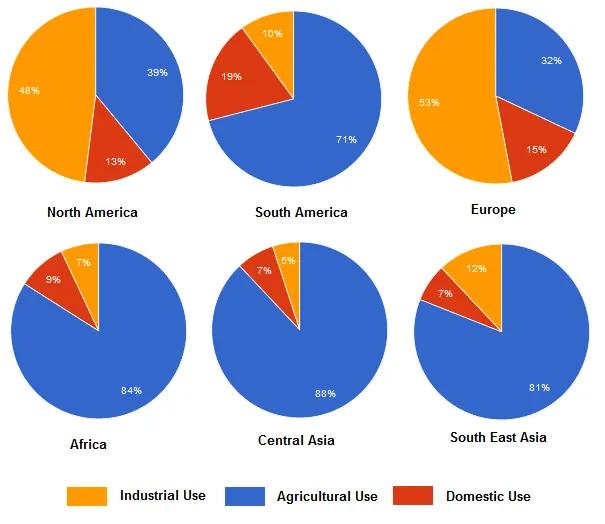
Six different pie charts relating to continents
reveals
Correct subject-verb agreement
reveal
show examples
the use of
water
in three different areas.
Usage
Correct article usage
The usage
show examples
of
water
is shown in percentages.
Overall
, it is evident that, out of the six areas of the world, four of them mostly use
water
for agricultural activity, which is more than 70 per
cent
.
On the contrary
,
water
used for domestic activities is recorded as less than 20% for all of them. Considering the usage of
water
for agriculture, we can clearly see that four continents namely, Central Asia, Africa, South East Asia and South America consume 88, 84, 81 and 71 per
cent
respectively.
On the other hand
, the rest two are below 40%. The least consumption of
water
is in the area of domestic activities which is ranging from 19% to the lowest 7%. In between the highest and lowest consumption, it is the industrial activities where the percentages of
water
are ranging from 5 per
cent
that is
recorded for Central Asia to 53 per
cent
for Europe.
Submitted by Nishant Chawda on

Unauthorized use and/or duplication of this material without express and written permission from this site’s author and/or owner is strictly prohibited. Excerpts and links may be used, provided that full and clear credit is given to Writing9 with appropriate and specific direction to the original content.

Introduction: The introduction is missing.
Introduction: Change the first sentence in the introduction.
Introduction: The chart intro is missing.
Basic structure: Change the third paragraph.
Introduction: The chart intro is missing.
Vocabulary: Replace the words water, cent with synonyms.
Vocabulary: Only 2 basic words for charts were used.
Vocabulary: The word "percentages" was used 2 times.
Vocabulary: Use several vocabularies to present the data in the second paragraph.
Vocabulary: Use several vocabularies to present the data in the third paragraph.
Topic Vocabulary:
  • consumption
  • irrigation
  • domestic
  • industrial
  • regional disparity
  • economic structure
  • sustainable management
  • water-scarce
  • population density
  • urbanization
  • data trends
  • resource allocation
  • percentage distribution
  • extremes
  • variations
What to do next:
Look at other essays: