The chart below shows the different levels of post-school qualifications in Australia and the proportion of men and women who held them in 1999. Summarise the information by selecting and reporting the main features, and make comparisons where relevant.

The chart below shows the different levels of post-school qualifications in Australia and the proportion of men and women who held them in 1999. 

Summarise the information by selecting and reporting the main features, and make comparisons where relevant.
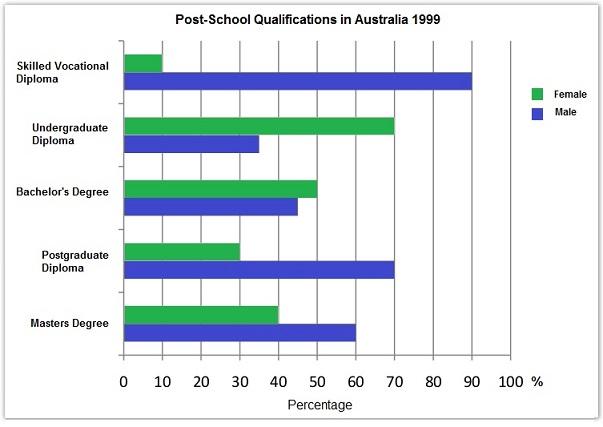
The bar chart illustrates the qualifications of females and males after school in Australia throughout the period in question. In detail, those who had a post-graduate diploma and skilled vocational diploma were dominated by the male gender with 70% and 90% respectively.
In contrast
to males, females had less percentage of these qualifications in 1999. Another important aspect of the graph is that ratio of undergraduate
diploma
Fix the agreement mistake
diplomas
show examples
and bachelor’s
degree
Fix the agreement mistake
degrees
show examples
were outweighed by women (70% and almost 55% respectively),
whereas
the proportion of men who had master’s
degree
Fix the agreement mistake
degrees
show examples
was considerably higher than women’s.
Overall
, men were ahead of women in terms of educational qualification in Australia in 1999, and three out of five types of these were mostly attended by men.
Submitted by emineknc on

Unauthorized use and/or duplication of this material without express and written permission from this site’s author and/or owner is strictly prohibited. Excerpts and links may be used, provided that full and clear credit is given to Writing9 with appropriate and specific direction to the original content.

Common mistake: Your writing should be 150-250 words.
Vocabulary: Use several vocabularies to present the data in the third paragraph.
What to do next:
Look at other essays: