
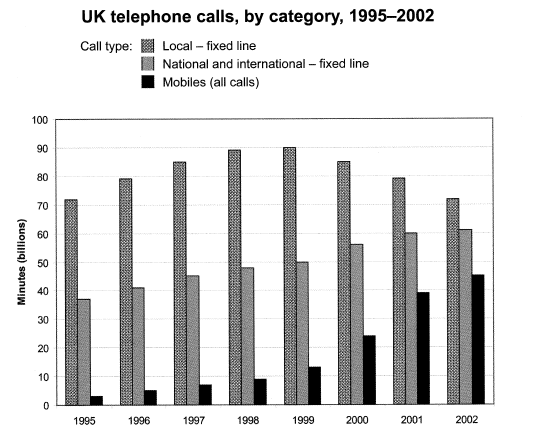
This
chart depicts a comparison of the Linking Words
usage
of telephone calls in the UK in three call type categories (local-fixed Use synonyms
line
, national and international-fixed Use synonyms
line
, mobile calls) from 1995 to 2002. The total time of telephone Use synonyms
usage
is calculated in a number of Use synonyms
minutes
(in billions).
Use synonyms
Overall
, the Linking Words
usage
of the local-fixed Use synonyms
line
had a steep rise followed by a gradual decline Use synonyms
whereas
, the Linking Words
usage
of the other two types has progressive upward trends. In 1990, British call Use synonyms
usage
was just above 70 Use synonyms
billion
Use synonyms
minutes
and rose until 1999 when it peaked and Use synonyms
then
slowly declined.
Linking Words
However
, the national international-fixed Linking Words
line
was less popular than the local-fixed Use synonyms
line
. In 1995, the national and international-fixed Use synonyms
line
was used for less than 40 Use synonyms
billion
Use synonyms
minutes
but it gained popularity when heading towards 2000 when it levelled off at 60 Use synonyms
billion
Use synonyms
minutes
. It is evident that the time spent on mobile calls started at less than 10 Use synonyms
billion
Use synonyms
minutes
but it reached a five-fold increase in caller Use synonyms
minutes
by 2002.Use synonyms