
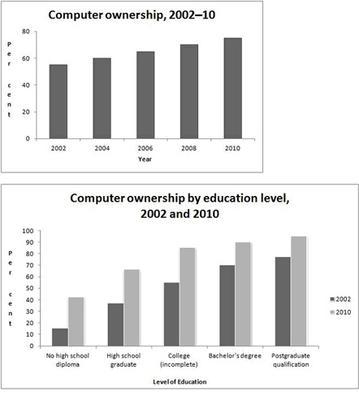
The first and second bar charts illustrate the proportion and educational status respectively, of people who had computers between 2002 and 2010.
Generally, it is noticeable that
,
the percentage of the population that possessed the devices increased over the 8 years period. Remove the comma
apply
Also
, there was a direct relationship between school qualifications and ownership of these gadgets.
In 2002, only about 58% of people had computers. Linking Words
This
number steadily increased over time to about 70% in 2010.
Linking Words
It is clear that
Linking Words
,
computers were least popular amongst those without high school diplomas, with only 15% of them having the hardware in 2002. Remove the comma
apply
However
, by 2010 Linking Words
this
number had risen by about 3 folds. Linking Words
Further
, for high school and college graduates, ownership increased by about 25% and 30% respectively, between 2002 and 2010. Linking Words
Finally
, computer possession was most prevalent amongst those with higher educational status. In 2002, 65% of those with bachelor's degrees had laptops or desktops; Linking Words
this
number Linking Words
had
climbed by 20% in 2010. Unnecessary verb
apply
Similarly
, from an initial proportion of 85%, a 15% rise was seen in those that had postgraduate degrees.Linking Words