
The chart illustrates the amount of manufacturing
paper
, Use synonyms
wood
pulp and sawn- Use synonyms
wood
in the UK for 20 years.
Use synonyms
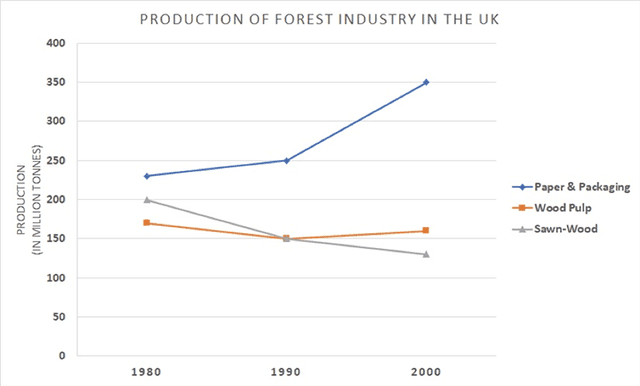
Overall
, there was a decrease in the number of sawn and pulp timber in 2000, Linking Words
while
a dramatic rise can be seen in producing Linking Words
paper
and packaging. Use synonyms
In addition
, Linking Words
paper
manufacturing is the highest figure throughout the period.
The amount of Use synonyms
paper
production started at approximately 240 million Use synonyms
tonnes
, after which it experienced a rise to exactly 250 lot Use synonyms
tonnes
in 1990, before ending the period with a subsequent increase at the peak of 350 million.
Use synonyms
Conversely
, the figure for both mentioned woodland hit a trough of precisely 150 million Linking Words
tonnes
in 1990. In the next 10 years, the amount of Use synonyms
wood
pulp was at roundly 160, followed by a slow rise. The opposite change can be seen in the figure for sawn Use synonyms
wood
, which fell to about 140 lot Use synonyms
tonnes
ending the period.Use synonyms