
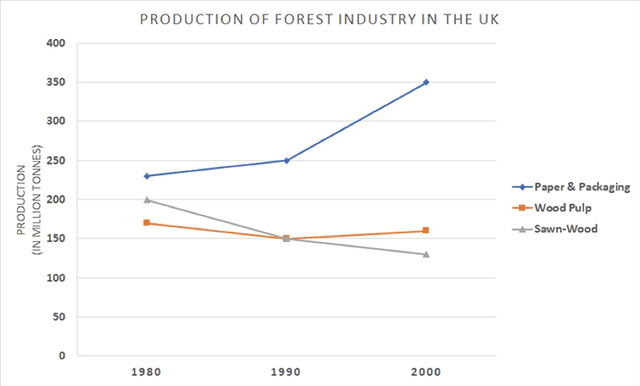
The line graph depicts the manufacturing of
paper
,Use synonyms
wood
Use synonyms
pulp
and sawn Use synonyms
wood
in the UK over 20 years,from 1980 to 2000.
Use synonyms
Overall
, the data indicate that Linking Words
paper
and packaging goods Use synonyms
production
increased from Use synonyms
time
to Use synonyms
time
.Use synonyms
Whereas
, making timber Linking Words
pulp
decreased for a certain period of Use synonyms
time
and started to increase again, Use synonyms
while
,producing sawn Linking Words
wood
declined over Use synonyms
time
.
First of all,in 1980, the Use synonyms
production
of Use synonyms
paper
items gradually increased. Use synonyms
However
, it has been seen that the progress was almost constant from 1980 to 1990, but from 1990 to 2000, it drastically changed and touched 350 Linking Words
million
Use synonyms
tonnes
from 200 Use synonyms
million
Use synonyms
tonnes
.
Use synonyms
On the other hand
, making Linking Words
wood
Use synonyms
pulp
goods slowly reduced from 1980 to 1990 when the Use synonyms
production
was 150 Use synonyms
million
Use synonyms
tonnes
. After 1990, the manufacturing of Use synonyms
wood
Use synonyms
pulp
started to grow again and it stopped with the Use synonyms
production
of 140 Use synonyms
million
Use synonyms
tonnes
.
Use synonyms
To sum up
, the Linking Words
production
of sawn-Use synonyms
pulp
rapidly changed and it declined from 200 Use synonyms
million
Use synonyms
tonnes
to 120 Use synonyms
million
Use synonyms
tonnes
in 20 years,Use synonyms
while
Linking Words
paper
Use synonyms
production
was the highest.Use synonyms