
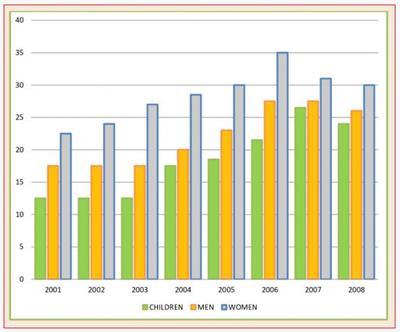
The bar chart compares the proportion of men, women and
children
in the UK ingesting Use synonyms
five
portions of Use synonyms
fruit
and Use synonyms
vegetables
daily over a period of eight years.
Use synonyms
It is clear that
the percentage of women consuming Linking Words
five
proportions of fruits and Use synonyms
vegetables
is Use synonyms
overall
higher than the other two groups of people over the period shown.
Linking Words
By contrast
, the group of Linking Words
children
can be seen to have the lowest proportion of those who eat a large amount of Use synonyms
fruit
and Use synonyms
vegetables
in their daily intake.
In 2001, over 20% of females consumed Use synonyms
five
proportions of Use synonyms
fruit
and Use synonyms
vegetables
, Use synonyms
while
males and Linking Words
children
had relatively low figures of around 17% and 12%. Since Use synonyms
then
, the percentage of women rose continuously and reached a peak of over 35% in 2006.
A similar tendency can be seen in the male group. From 2001 to 2003, the figure for males remained stable Linking Words
then
slowly increased, and peaked at around 27% in 2006. Linking Words
However
, the figures for Linking Words
children
eating Use synonyms
five
proportions of Use synonyms
fruit
and Use synonyms
vegetables
have always been the lowest, but an increasing trend is Use synonyms
also
shown. And in 2007 saw about 25% of Linking Words
children
ate Use synonyms
five
portions a day.Use synonyms