
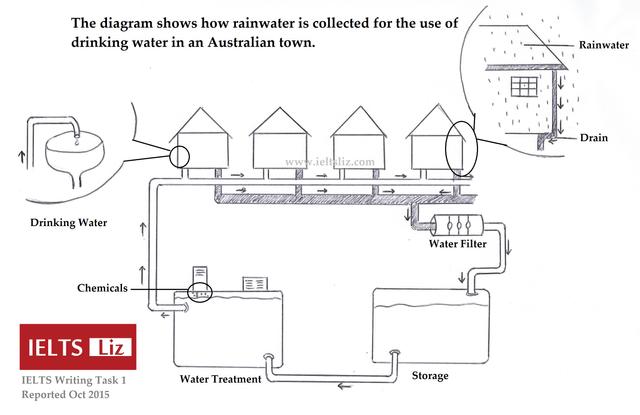
The figure illustrates the
process
used to make drinking Use synonyms
water
by rain, in a little city in Australia. Use synonyms
Overall
, it can be seen that it is not a complicated Linking Words
process
which is formed only by six stages, the linear Use synonyms
process
, technically begins when there are Use synonyms
atmosferic
precipitations, Correct your spelling
atmospheric
through
it can continue to loop indefinitely every time it rains.
Correct your spelling
though
Firstly
, the saving procedure starts on the roof of the house, from which all the drops fall down into the drain, which is under the structure. Later the rain arrives at the Linking Words
water
filter where is cleaned and the next phase is Use synonyms
the
storage, Correct article usage
apply
inside
which is collected the Change preposition
apply
water
before the treatment.
At that point, the Use synonyms
water
is ready to be filtered one more time with the addition of some chemicals Use synonyms
at
the Change preposition
in
process
that makes the Use synonyms
water
drinkable. Use synonyms
Finally
, Linking Words
on
the Change preposition
in
last
Linking Words
phase
every person in the town can enjoy the Add a comma
,phase
water
from the tap of his house.Use synonyms