
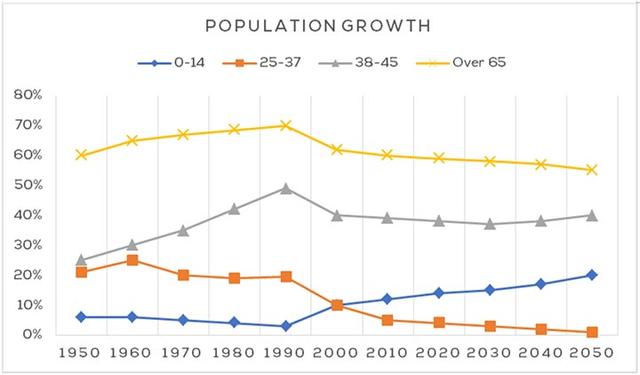
The graph compares the proportion of four
Use synonyms
group
of ages in New Zealand in the period between 1950 and 2050.
During Change to a plural noun
groups
this
time, two Linking Words
groups
with the age Use synonyms
from
35 to above have increased from 1950 to 2050, Change preposition
apply
while
two other Linking Words
groups
have experienced a decrease. Use synonyms
Group
35-74 is the Use synonyms
group
with the most dramatic increase in the percentage of Use synonyms
Use synonyms
population
and has the highest data in 1950.
In 1950, the percentage of the Add an article
the population
population
in Use synonyms
groups
0-14, 15-34, 35-64 and 65 plus were estimated at around 10%, 15%, 28% and 32% respectively. Over the following 40 years, the 15-34 Use synonyms
group
rose strongly to about 45%, Use synonyms
while
three other Linking Words
groups
only changed slightly. In 2023,Use synonyms
0
-14 Correct article usage
the 0
group
and the 35-64 Use synonyms
group
have the same figure for Use synonyms
Use synonyms
population
and Correct article usage
the population
group
35-65 Use synonyms
group
begin overtakingUse synonyms
0
-14 Correct article usage
the 0
group
.
In 2030,Use synonyms
0
-14 Correct article usage
the 0
group
will continue to be overtaken by the Use synonyms
65 above
Add a hyphen
65-above
group
at around 16%, Use synonyms
while
the percentage of Linking Words
Use synonyms
population
of the 15-34 Add an article
the population
group
will be still Use synonyms
highest
. In 2045, Correct article usage
the highest
35
-64 Correct article usage
the 35
group
will start to overtake the 15-34 Use synonyms
group
at 30% and become the Use synonyms
group
with the biggest proportion of Use synonyms
Use synonyms
population
in New Zealand. In the Add an article
the population
last
year in the graph, the data of the Linking Words
population
of 4 Use synonyms
groups
are predicted in order from 0 to 65 above years old at about 10%, 29%, 34% and 20% respectively.Use synonyms