
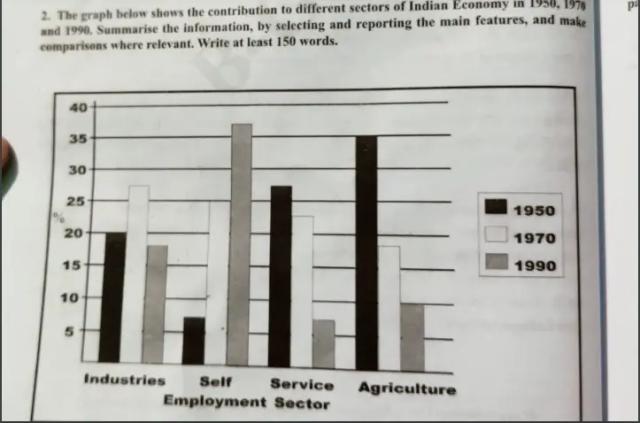
the bar chart illustrates the contribution of various factors to the Indian economy between 1950,1970 and 1990.
This
is clear from the graph that, in 1950 and 1990 the sectors has been fluctuated except in 1970. Linking Words
According to
what is shown Linking Words
firstly
, in 1950 starting with industries which were 20 per Linking Words
cent
and slightly increased in 1970. Use synonyms
While
it fell from 27 per Linking Words
cent
to just under 20 per Use synonyms
cent
.
Use synonyms
Secondly
, self-employment climbed dramatically from approximately 7 per Linking Words
cent
to 36 per Use synonyms
cent
which was the highest percentage compared to the other features Use synonyms
in addition
to being the most contribution to the economy .
Linking Words
Finally
, the service sector and agriculture had nearly the same ratio in the three years with 26 % being the highest proportion in the service sector and Linking Words
moreover
, agriculture hit a peak of 35%.
In Linking Words
conclusion
we can say that all the features assisted the economy in several ways ,Add a comma
,conclusion
however
, self-employment has been the most helpful.Linking Words