
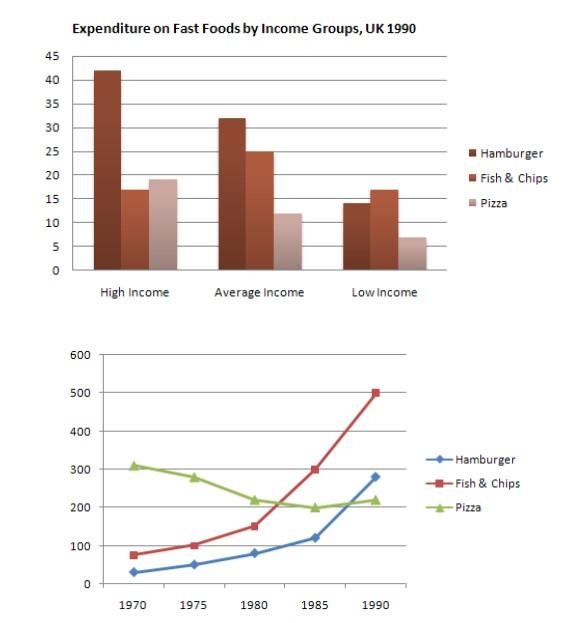
The given
chart
provides information regarding the fast food Use synonyms
consumption
rate in Britain based on people's incomes. The second Use synonyms
chart
indicates the changeable Use synonyms
consumption
of three types of food in a period of time between 1970 to 1990.
In regards to the first Use synonyms
chart
, it can be seen that the spending on hamburgers is the highest among communities with good income by about 40 Pence, Use synonyms
as well as
, those with the average one which reached about 33 Pence per person.Fish and chips, Linking Words
however
, are bought notably higher by people with average income, Linking Words
while
the high and low income share a similar trend of Linking Words
consumption
of approximately 17 Pence per person every week. Spending on pizzaUse synonyms
,
shows Remove the comma
apply
comparable
trend to hamburger which Add an article
a comparable
the comparable
it
is mostly bought by people with high, Correct pronoun usage
apply
then
average, and followed by low incomes.
The other Linking Words
chart
which shows the variable rate of the Use synonyms
consumption
of fast food indicates that the hamburger Use synonyms
consumption
rate kept gradually rising from 100 grammes in 1970 to more than 500 in 1990. Meanwhile, fish and chips appeared to slowly decrease from 300 grammes 1970 to stay on a constant Use synonyms
consumption
between 250 to 200 from 1975 to 1990. Use synonyms
Lastly
, pizza showed a gradual increase since 1980 to reach about 290 in 1990.Linking Words