
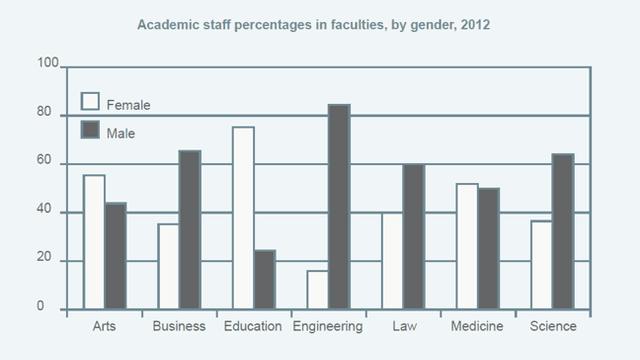
The bar graphs compare the academic working force in different faculties of an educational facility in 2012.
Overall
, it can be seen that both sexes have different interests depending on the subjects given in each department.
The most remarkable difference is seen between Engineering and Education.With male predominance in the first section reaching almost three-quarters of the working staff. Females, Linking Words
on the other hand
, played a major role in the employees of the educational department reaching 72% of the working team.
Linking Words
This
variation continues to be noticed in other institutes with less difference between both genders. Science and Law were similar as they showed almost a 3:2 male-to the female ratio which is the opposite trend when compared to arts where approximately two-thirds of the staff were females.
The medicine showed a unique response where both sexes shared Linking Words
this
institute equally with 50% and 49% for men and women , respectively.Linking Words