
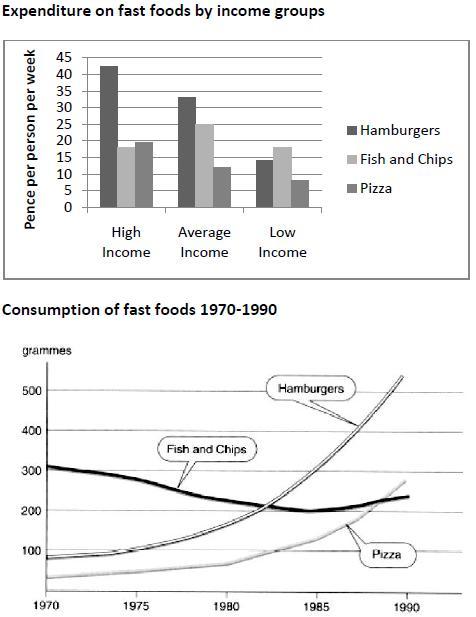
The chart illustrates how much money is being spent on junk food divided by the income. every week in Britain and the graph indicates the changes in the consumption of different kinds of fast foods in the span of 20 years, from 1970 to 1990.
Firstly
, as it is visual, high-income people consume the most junk foods, Linking Words
whereas
low-income people eat healthier than wealthier individuals. Hamburgers are the most popular fast food among rich and normal-income families and individuals, Linking Words
while
fish and chips are more popular among the poor. Fish and Chips are mostly bought and used by the ordinary income part of society.
Linking Words
Secondly
, eating hamburgers became a trend in 1975 and has been growing ever since. Fish and Chips had a subtle fall in usage from 1970 to 1985 and Linking Words
then
rose up from 1985 to 1990, in 5 years. Pizza hasn’t had any sort of Linking Words
change
in popularity in these 20 years.Add an article
the change