
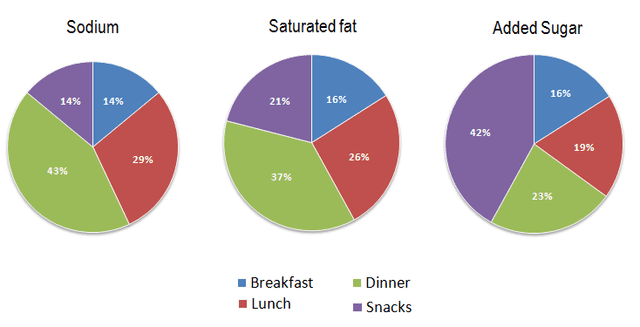
The pie charts give information about the average proportion in usual meals of three types of fibres sodium, saturated fat and added
sugar
, all of which may be harmful if eaten too much. It is important to note that the measure of using these nutrients in dinner is higher except for added Use synonyms
sugar
in that meal.
Use synonyms
Firstly
, the amount of sodium which stood at 43% is not comparable with the two other types in dinner Linking Words
also
, the usage of added Linking Words
sugar
at snack time is 42% which is double the saturated fat in it. Use synonyms
Moreover
in breakfast, the ratio of added Linking Words
sugar
and Saturated fat is 16% so they are the same in these two types.
Use synonyms
Likewise
, at lunchtime, the rate of sodium is 29% is higher than others and after saturated fat is 26% which is in the second stage Linking Words
furthermore
, added Linking Words
sugar
is not a big part of lunchtime and it is just under a quarter.Use synonyms