The first graph gives the number of passengers travelling by train in Sydney. The second graph provides information on the percentage of trains running on time. Summarise the information by selecting and reporting the main features, and make comparisons where relevant.

The first graph gives the number of passengers travelling by train in Sydney. The second graph provides information on the percentage of trains running on time. Summarise the information by selecting and reporting the main features, and make comparisons where relevant.
IELTS Writing Task Chart for The first graph gives the number of passengers travelling by train in Sydney. The second graph provides information on the percentage of trains running on time. Summarise the information by selecting and reporting the main features, and make comparisons where relevant.
✨ Do you want to improve your IELTS writing?
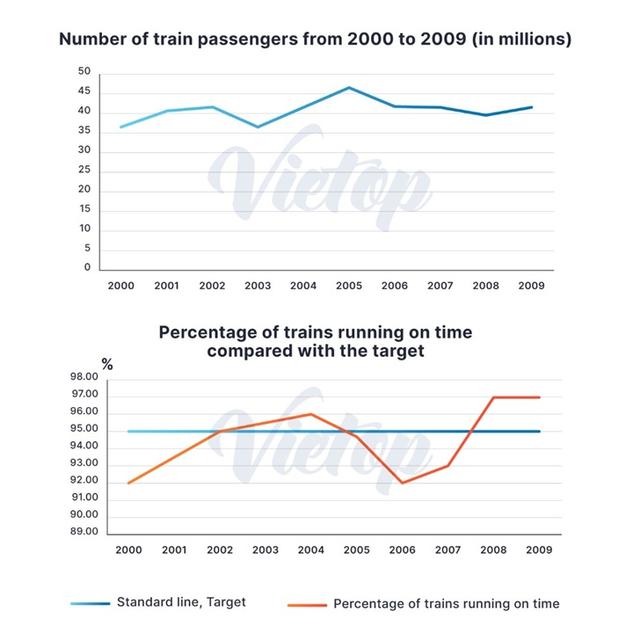
Two line graphs illustrate the information about how many people travel by train and the proportion of
trains
Use synonyms
arriving punctually in Sydney between 1995 and 2004.
Overall
Linking Words
, it is apparent that there was an upward trend in the figure for commuters taking
trains
Use synonyms
during the trips, whilst the punctuality rate of
this
Linking Words
type of public transportation fluctuated over the period shown, reaching the lowest point in 2004. As for the number of train passengers, a slight increment can be seen from 1995 to 1999, with the figure rising from 250
million
Use synonyms
to approximately 265
million
Use synonyms
. Afterwards, the equivalent figure increased remarkably during the following two years, peaking at 300
million
Use synonyms
in 2001.
However
Linking Words
, it was followed by a noticeable plunge, as the number of people who took
trains
Use synonyms
when travelling fell to 280
million
Use synonyms
in 2002 and had continued to decrease by a negligible amount since
then
Linking Words
. Turning to the proportion of
trains
Use synonyms
that arrived on time, we can witness a significant fluctuation throughout the years 1995 and 2003, when the punctuality rate waved between 86% to about 93%.
Additionally
Linking Words
, more striking is that an increasing number of
trains
Use synonyms
arrived at their destinations late from 2003 to 2004, since the percentage of punctual arrivals plunged dramatically from 92% to less than 75%.

Unauthorized use and/or duplication of this material without express and written permission from this site's author and/or owner is strictly prohibited. Excerpts and links may be used, provided that full and clear credit is given to Writing9 with appropriate and specific direction to the original content.

Vocabulary: Replace the words trains, million with synonyms.
Vocabulary: The word "figure" was used 3 times.
Vocabulary: The word "number of" was used 3 times.
Vocabulary: The word "proportion" was used 2 times.
Vocabulary: The word "plunge" was used 2 times.
Vocabulary: The word "about" was used 2 times.
Topic Vocabulary:
  • passenger volume
  • trend
  • peak times
  • off-peak times
  • punctuality
  • infrastructure
  • correlation
  • traffic
  • delays
  • satisfaction
  • efficiency
  • transportation system
  • reliability
  • urban mobility
  • capacity
What to do next:
Look at other essays: