
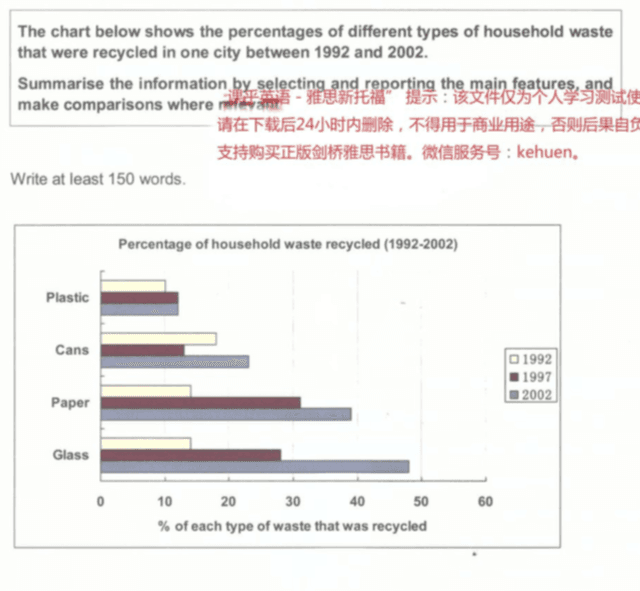
The bar chart demonstrates the
overall
percentages of four kinds of household recycling items in a certain region from 1992 to 2002, namely Linking Words
plastic
, Use synonyms
cans
, Use synonyms
paper
, and Use synonyms
glass
.
Use synonyms
Paper
and Use synonyms
glass
saw the biggest rise in recycling over the 10-year period. In 1992, the percentage of Use synonyms
paper
and Use synonyms
glass
that were recycled saw identical numbers at almost 15%, which were the second largest figures among the four kinds of household Use synonyms
waste
. Over the following five years, the recycling Use synonyms
rate
of Use synonyms
paper
overtook Use synonyms
glass
and became the most recyclable category of family Use synonyms
waste
reaching above 30%, Use synonyms
whereas
the figure for Linking Words
glass
was around 28%. By 2002, Use synonyms
glass
became the major recycling item in each family and the Use synonyms
rate
of recycling increased by approximately 20% compared with the data in 1997.
The other two types of family Use synonyms
waste
that were reused were Use synonyms
plastic
and Use synonyms
cans
. In 1992, Use synonyms
cans
were the most common recycling Use synonyms
waste
with the data reaching 18%, Use synonyms
on the other hand
, the recycling Linking Words
rate
Use synonyms
on
Change preposition
for
plastic
was the lowest in the same year at just 10%. Use synonyms
Although
a slight drop in household recycling Linking Words
rate
on Use synonyms
cans
was seen in 1997, the figure was still higher than that of Use synonyms
plastic
(around 12%). By 2002, Use synonyms
reusing
Correct article usage
the reusing
rate
of Use synonyms
cans
grew to almost a quarter, Use synonyms
while
Linking Words
plastic
remain unchanged at the same level.Use synonyms