
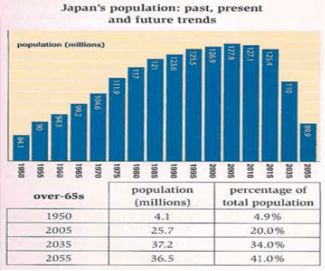
The following chart below illustrates the figure of Japanese citizens from 1950 to the present and the estimated populace until 2055. The table below provides information about the percentage of the populace between 1950 and 2055.
Overall
, Linking Words
it is clear that
Japan's community has grown steadily until 2005, and Linking Words
according to
predictions, it will decrease sharply until 2055. There is no doubt that from 1950 to 2055, the figure for people aged 65 or older is expected to rise dramatically.
Linking Words
First,
the community was 84.1 Linking Words
million
, and it increased every year by approximately 1, 2 or 3 Use synonyms
million
, and it increased by 7 or 8 Use synonyms
million
once in a blue moon. Use synonyms
As a result
of Linking Words
such
growth, the number of people reached 127.8 Linking Words
million
in 2005. Use synonyms
Then
, for 15 years, Linking Words
this
indicator dropped and in 2015 it fall to 125.4 Linking Words
million
. In the next 40-year period, Use synonyms
this
figure is expected to dwindle to 89.9 Linking Words
million
.
Use synonyms
Second,
from 1950 to 2005, the number of citizens over 65 increased dramatically from 4.1 Linking Words
million
to 25.7 Use synonyms
million
. Use synonyms
In other words
, Linking Words
this
means a rise in the percentage indicator from 4.9 % to 20.0 %. It is estimated that the population will increase by approximately 12 Linking Words
million
, and the proportion indicator will increase by 14 % over the next 30-year period. By 2055, Use synonyms
although
the number of people over 65 years has decreased Linking Words
as a result
of the decrease in the total population, their proportion has reached its peak of 41%.Linking Words