
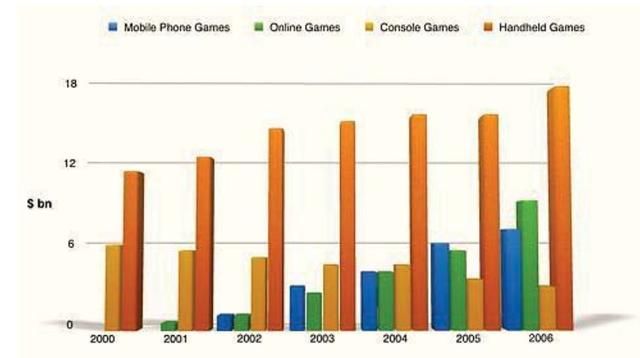
The charts illustrate how many types of virtual
games
were sold in the world (mobile, phone, console and handheld Use synonyms
games
), from 2000 to 2006.
Use synonyms
Overall
, it can be seen that the market of Handheld Linking Words
Games
was by far, the most profitable market, Use synonyms
while
the other three types of Linking Words
games
were twice as low.
Use synonyms
According to
the bar chart, Handheld Linking Words
Games
reported the highest number of sales, accounting for almost 12 Use synonyms
billion
in 2000, which increased to 18 Use synonyms
billion
dollars by 2006. Console Use synonyms
games
were the only category that suffered a steady drop by 2006, starting from 6 Use synonyms
billion
and decreasing to 3 Use synonyms
billion
. Use synonyms
In contrast
, Mobile Phones and Online Linking Words
Games
had an almost similar tendency. Both trends reached the global market respectively in 2001 and 2003 (2 Use synonyms
billion
) and reported equal sales in 2004. No mobile phone Use synonyms
games
sales were reported between 2000 and 2001. Clearly, the most impressive dates were made by The Handheld Use synonyms
Games
which in 2000 sold out about double in comparison to the other Use synonyms
games
.Use synonyms