
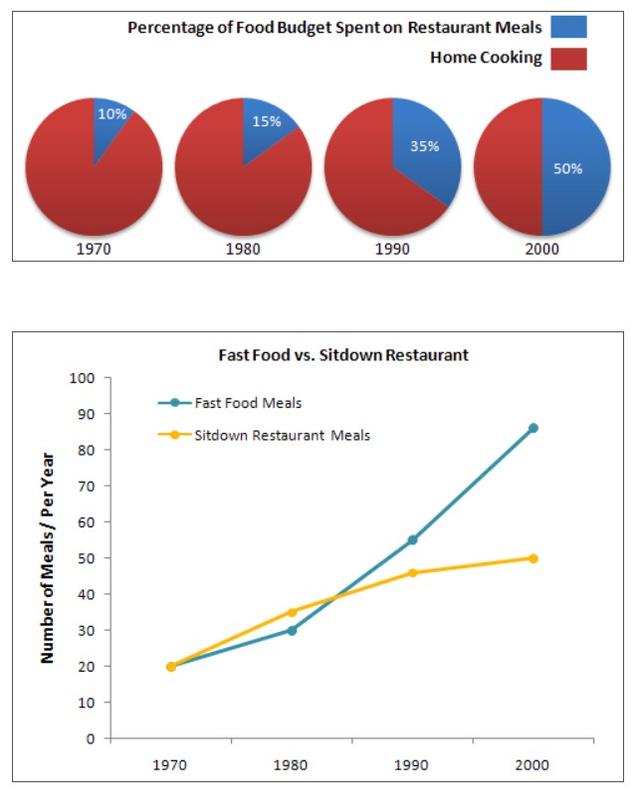
The first chart illustrates the
percentage
of the average family's Use synonyms
food
budget spent on Use synonyms
restaurant
Use synonyms
meals
in different Use synonyms
years
from 1970 to 2000. There are two different kinds of meal budgets, the first is Use synonyms
restaurant
Use synonyms
meal
and the second is home cooking.
The second graph shows the Fix the agreement mistake
meals
number
of Use synonyms
meals
eaten in fast Use synonyms
food
Use synonyms
meals
and sit-down restaurants Use synonyms
meals
from 1970 to 2000.
From 1970 to 2000 the Use synonyms
percentage
of the Use synonyms
food
budget spent on Use synonyms
restaurant
Use synonyms
meals
increased, in the first Use synonyms
year
it was just 10% and Use synonyms
then
became 15% in 1980, next was 1990 the Linking Words
percentage
was 35% which experienced increasing, and the Use synonyms
last
Linking Words
year
in 2000 the Use synonyms
percentage
was increased to 50%. Home cooking decreased, in 1970 was 90%, 10 Use synonyms
years
later Use synonyms
bacame
85%, Correct your spelling
became
the
next 10 Change preposition
in the
years
the Use synonyms
number
decreased to 65% and in 2000 it became 50%.
The Use synonyms
number
of Use synonyms
meals
had increased Use synonyms
year
by Use synonyms
year
. Fast Use synonyms
food
extremely increased from 1980 to 2000, the Use synonyms
number
starts Use synonyms
with
20 and Change preposition
at
end
Correct subject-verb agreement
ends
in
88. The sit-down Change preposition
at
restaurant
Use synonyms
meals
Use synonyms
also
increased from 20 to 50. In 1981 the line of Linking Words
graph
was met around Add an article
the graph
a graph
number
40.
Use synonyms
To sum up
, Linking Words
Increased
happened to Correct article usage
an Increased
Use synonyms
percentage
of Correct article usage
the percentage
Restaurant
Use synonyms
meals
and Use synonyms
decreased
in home cooking. The Replace the word
decrease
number
of fast Use synonyms
food
Use synonyms
meals
and Use synonyms
sitdown
Correct your spelling
sit-down
meals
Use synonyms
are
increased every ten Change the verb form
is
years
.Use synonyms