
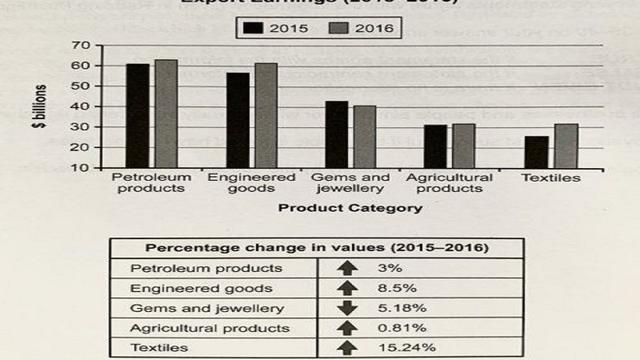
The bar chart compares how much a certain country earned through its exports of five categories of
products
in the years 2015 and 2016. The table gives information on the corresponding ratio changes in export revenues from these five product categories in these Use synonyms
two
years.
Use synonyms
It is clear that
earnings from the exportations of petroleum Linking Words
products
and engineering Use synonyms
products
were the Use synonyms
two
largest components of the total value. Use synonyms
By contrast
, textiles and agricultural Linking Words
products
made a relatively small export contribution.
In 2015, petroleum Use synonyms
products
played the most important role in exports, earning approximately $60 Use synonyms
billion
, followed by engineering goods with approximately $55 Use synonyms
billion
. Use synonyms
Although
2016 saw a rise of 3% in the value change of petroleum Linking Words
products
as well, a more significant increase was observed in engineering Use synonyms
products
, with a figure of 8.5%. The contributions of these Use synonyms
two
categories were almost identical in 2016, at around $62 Use synonyms
billion
.
Use synonyms
While
revenues from gems and jewellery decreased by 5.18% to just $40 Linking Words
billion
, export revenues from textiles increased significantly by 15.24% to reach $31 Use synonyms
billion
in 2016. The values of exports of agricultural Use synonyms
products
were relatively close between the Use synonyms
two
years, at about $31 Use synonyms
billion
.Use synonyms