
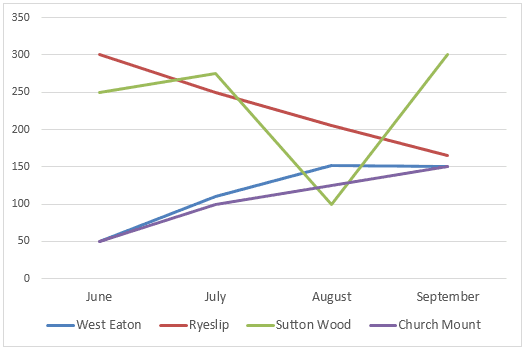
The line graph shows the number of
books
that people rented from four libraries during June, July, August and September in 2014. The pie chart illustrates the data about what kinds of Use synonyms
books
were borrowed during the same period in these four places.
In general, what could be highlighted from the graph is that the number of Use synonyms
books
rented in Ryeslip experienced a sharp drop between June and September. Another interesting point is that biography Use synonyms
books
are the most popular type.
Looking at the details, as regards Sutton Wood, it can be clearly seen that the number of Use synonyms
books
Use synonyms
were
borrowed in Unnecessary verb
apply
this
library fluctuated during the observed period. It started at 250 Linking Words
books
in June, increased slightly to approximately 280, experienced a gradual drop and Use synonyms
then
reached a peak at 300 in September.
Talking about the pie chart, it can be mentioned that the other four kinds of Linking Words
books
are not as widespread as the biography ones. They have approximately the same percentage.Use synonyms