
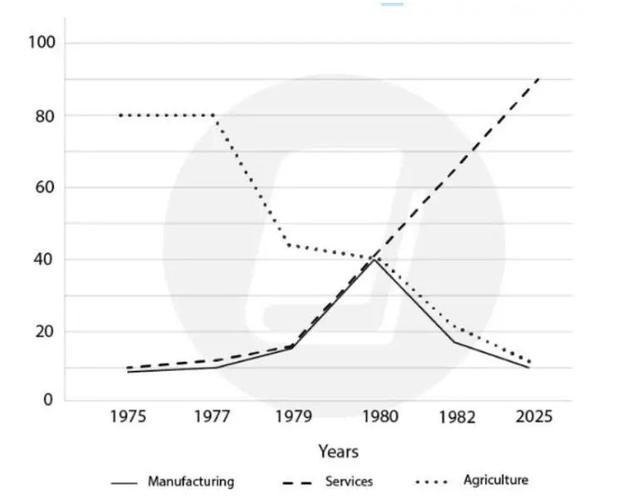
The graphic shows the
employment
trends and predicts the future based on the past Use synonyms
years
.
Use synonyms
Over
Correct your spelling
Overall
all
we can see that the services had a big rise over the Add a comma
,all
years
, Use synonyms
on the
Linking Words
contrary
Add the comma(s)
,contrary
the
Correct article usage
apply
agriculture
went down gradually. And Use synonyms
Linking Words
lastly
the manufacturing had a sharp up and a sharp down.
Starting with Add a comma
,lastly
agriculture
, in 1975 Use synonyms
wher
80 Correct your spelling
where
millions
of Fix the agreement mistake
million
employment
, the number stayed steady until 1977 when it decreased Use synonyms
little
more than 40 Change preposition
by little
millions
. From 1979 to 1980 it kept slightly going down. The predictions say that Change to singular
million
the
Correct article usage
apply
agriculture
will keep falling in the next few Use synonyms
years
.
Use synonyms
On the other hand
, the services remain steady for the first four Linking Words
years
, but after Use synonyms
that
the line climbs rapidly, to a top prediction of 90 million Add a comma
,that
employees
.
Use synonyms
The manufacturing
Correct article usage
Manufacturing
employment
stayed constant for the first two Use synonyms
years
, after that it started to increase slowly, until 1979 when it had a significant rise to 50 million Use synonyms
employees
in 1980, but the rise quickly had the same impact dropping. The drop is predicted to Use synonyms
last
until 2025.
In conclusion, the Linking Words
employment
lines in the USA are very variable depending on the job. But concretely the predictions for 2025 Use synonyms
has
an approximate of 10 million Correct subject-verb agreement
have
employees
in manufacturing and Use synonyms
agriculture
, and 90 Use synonyms
employees
in services.Use synonyms