
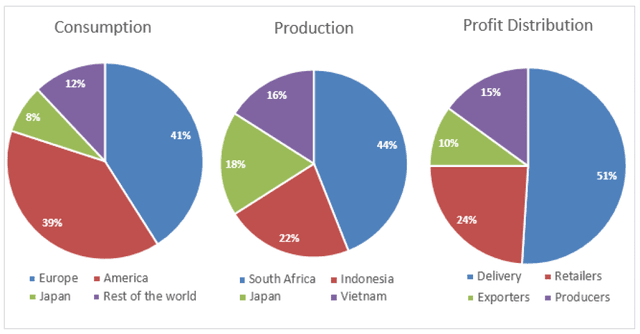
The pie charts depict data about global
coffee
consumption and production, and its profit distribution. Use synonyms
Overall
, Linking Words
it is clear that
most coffees were produced and consumed in some specific regions. Linking Words
Additionally
, delivery was the primary sector in the profit distribution.
In terms of Linking Words
coffee
consumption, people in three areas including Europe America and Japan consumed largely. The component in Europe accounted for 41%, which was the largest with the following 39% in America. Use synonyms
Furthermore
, Japan contributed almost one-tenth which was significantly smaller than these two regions.
Similar trends occurred in Linking Words
coffee
production. South Africa was the leading Use synonyms
coffee
producer, which means they composed 44% of the world. The figure in Indonesia and Japan were 22% and 18% respectively which were nearly half of that in South Africa.
Use synonyms
Moreover
, regarding the profit aspect, the delivery industry gained the biggest distribution marked more than 50%. The second was retailers and they distributed 24%. The remaining factors accounted for around 10%. (15% in producers and 10% in exporters)Linking Words