
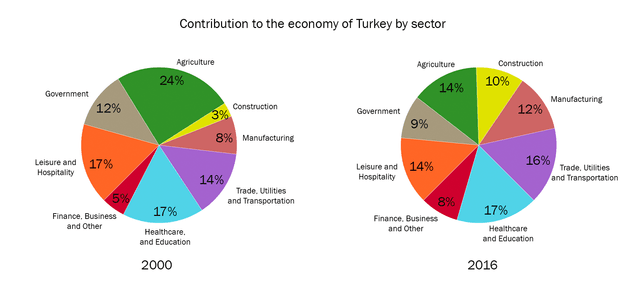
The two pie charts give information on the proportion of industry sectors' contribution to the economy of Turkey in 2000 and 2016. A period of 16 years.
Overall
, it can seem that the total of Linking Words
Healthcare
and Use synonyms
Education
in 2000 and 2016 were similar. Use synonyms
In addition
, the total of Agriculture was highest in 2000. In ,contrast construction was lowest in 2000. And in 2016, Linking Words
healthcare
and Use synonyms
education
were the highest and the lowest in government.
The first pie charts provided information in 2000 in which the highest proportion was Agriculture at 24 per Use synonyms
cent
. Followed by Use synonyms
healthcare
and Use synonyms
education
and leisure and hospitality were 17 per Use synonyms
cent
respectively.
The Second pie chart shows data in 2016 that Use synonyms
healthcare
and Use synonyms
education
were highest was 17 per Use synonyms
cent
. Followed by trade, United and transportation, leisure and hospitality were 16 per Use synonyms
cent
and 14 per Use synonyms
cent
.Use synonyms