
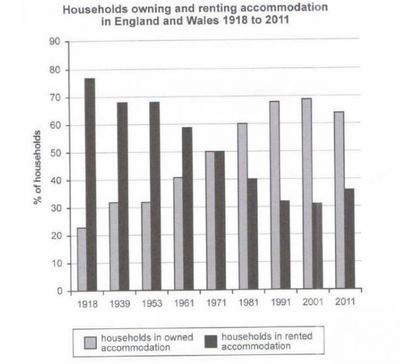
The bar chart illustrates the rate of families who are landowners and tenants in the country of England and Wales over a 93-year period.
Overall
, it appears that the number of homes rented reduced over time in the century Linking Words
while
the number of homeowners elevated till the end of the timeline.
Linking Words
For instance
, in 1918, just one-fifth of them owned buildings which Linking Words
then
rose to three out of ten in the next time period Linking Words
further
growing by 10% from 1953 till 1991 at 68% Linking Words
additionally
peaking at 69% in 2001 though it ended the period at 64%. Linking Words
Conversely
, the rate of rent was at its all-time high at the beginning of the time and it correspondingly decreased by a-tenth each decade.
In summary, Linking Words
although
the number of clans most definitely multiplied, the rate at which they were landowners went up too only being equal to renters after 53 years. Linking Words
Besides
the points when both metrics were similar from 1939 to 1953 and from 1991 to 2001, the trends can be considered to be inversely proportional.Linking Words