The graph below shows the quantities of goods transported in the UK between 1974 and 2002 by four different modes of transport. Summarise the information by selecting and reporting the main features, and make comparisons where relevant.

The graph below shows the quantities of goods transported in the UK between 1974 and 2002 by four different modes of transport.

Summarise the information by selecting and reporting the main features, and make comparisons where relevant.
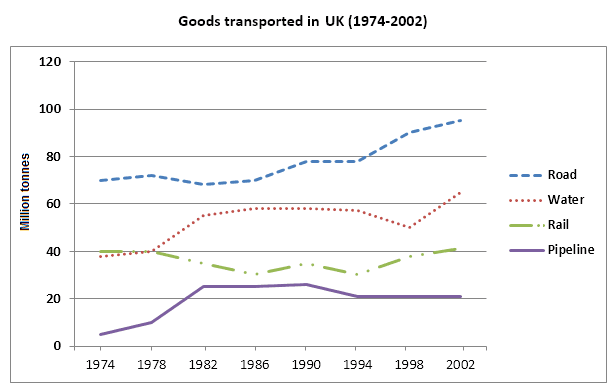
The line graph gives information about how
goods
were transported in the UK
Change preposition
over
show examples
a 28-year period from 1974. The data is measured in million tonnes for road, water, rail and pipeline modes of transport.
Overall
,
it is clear that
there was a substantial increase
of
Change preposition
in
show examples
goods
by road, water and pipeline
transports
Fix the agreement mistake
transport
show examples
over the period shown. By stark contrast the indication for rail transported
goods
experienced a dramatic decline, afterwards, it stagnated
is
Correct your spelling
in
show examples
first
Change the article
the first
show examples
position until 2002. Looking at the details, the number of
goods
by road and water went up considerably from their initial around 70 to just under 100 and from about 40 to just over 60 between 1974 and 2002
accordingly
. The quantity of transported
goods
by pipeline was almost 1 million in 1794, it rocketed by over 20 till 2002 By stark contrast, the figure for
rail transported
Add a hyphen
rail-transported
show examples
goods
almost remained unchanged until 2002,
while
this
figure witnessed visible fluctuation between around 16 years from its initial 40 in 1974.
Submitted by moxinurabjalilova on

Unauthorized use and/or duplication of this material without express and written permission from this site’s author and/or owner is strictly prohibited. Excerpts and links may be used, provided that full and clear credit is given to Writing9 with appropriate and specific direction to the original content.

Vocabulary: Replace the words goods with synonyms.
Vocabulary: Rephrase the word "information" in your introduction.
Vocabulary: The word "figure" was used 2 times.
Vocabulary: The word "almost" was used 2 times.
Vocabulary: The word "about" was used 2 times.
Vocabulary: The word "around" was used 2 times.
Topic Vocabulary:
  • Overview
  • Trend
  • Fluctuation
  • Peak
  • Trough
  • Increase
  • Decrease
  • Stability
  • Mode of transport
  • Quantity
  • Comparison
  • Goods
  • Transported
  • Significant
  • Noticeable
  • General trend
  • Time span
What to do next:
Look at other essays: