
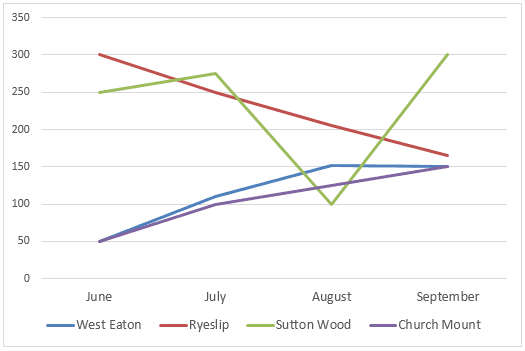
The line chart illustrates the data of
books
from June to September 2014 that were lent in four different village libraries, Use synonyms
as well as
the pie graph presents the proportion of Linking Words
books
which were lent during Use synonyms
this
time Linking Words
according to
classification. Linking Words
Overall
, it is apparent that most people borrow these Linking Words
books
at distinct times in four villages and fiction is the kind of book most favoured over Use synonyms
this
time.
Linking Words
To begin
with, the figure for the Rye slip was a dramatically downward trend its start point was 300 Linking Words
patterns
in June, but Use synonyms
then
slowly fell to half Linking Words
patterns
compared to the first month. Use synonyms
On the other hand
, the rest of other libraries have these Linking Words
patterns
which are borrowed much more in the Use synonyms
last
month, when both West Eaton and Church Mount were the same data in June and September respectively 50 Linking Words
books
and 150 Use synonyms
books
. Use synonyms
Additionally
, the number of Sutton Wood saw its highest point (300 Linking Words
books
) Use synonyms
last
time, Linking Words
however
, it strongly decreased in August (100 Linking Words
patterns
)
To turn to the pie chart, fiction is the most preferred when it has lent more than 40%. Use synonyms
Moreover
, there were similar percentages of science and history which accounted for 10%, the type of self-help and biography respectively 10% and 19%.Linking Words