
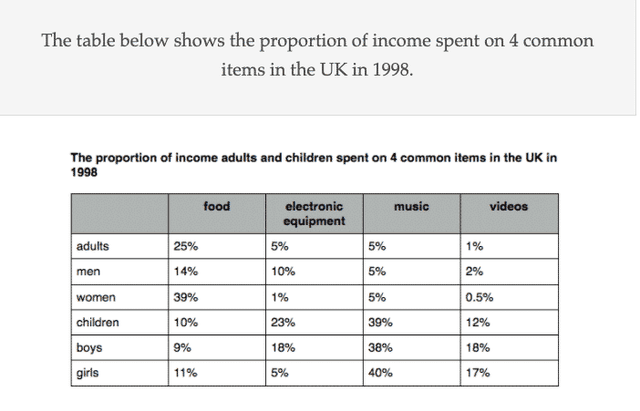
The picture illustrates the rates of spending
money
by adults (men and Use synonyms
women
) and children (boys and girls) in the UK on 4 common goods in 1998. The items include food, electronic equipment, Use synonyms
music
and videos. Use synonyms
Overall
, the most items Linking Words
that
were the expenditure on Correct pronoun usage
apply
music
by girls Use synonyms
while
the least was on video by Linking Words
women
.
The number of British adults, both men and Use synonyms
women
, that used their Use synonyms
money
for food was 25%, 14%, and 39% respectively, and they spent only 0,5-2% on videos. The equipment that was the most bought by men was electronic at 10% and Use synonyms
women
only 1%. The Use synonyms
money
that all of the Use synonyms
adults'
group spent on Change noun form
adults
music
remained the same at 5%.
The most income spent by all gender in children was on Use synonyms
music
at around 38-40% and the least Use synonyms
money
that they invested on food was 10% on average. Electronic equipment that children buy was 23% with 18% being boys. The rate of videos that were taken by the kids group was 12% with the number of boys were 18% and girls at 17%.Use synonyms