
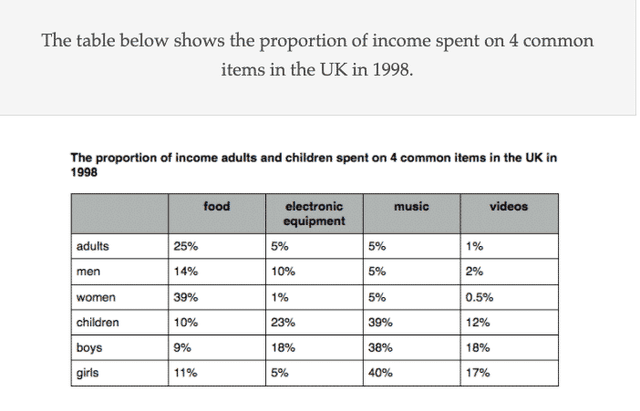
The given table illustrates the comparison of different age groups used up their income for 4 common items in the UK in 1998.
Overall
it can be seen that the most expenditures of adults, men, and women are on Linking Words
food
Use synonyms
while
children, boys, and girls are on music. Meanwhile, the other facts that are given from the table are adults, men, and women Linking Words
also
spend the least figure on the same items which are on Linking Words
food
Use synonyms
as well as
women and children on Linking Words
food
, apart from girls who spent on electric equipment.
Looking at the table in more detail, adults spent the maximum on Use synonyms
food
Use synonyms
accounted
for a quarter Wrong verb form
accounting
while
Linking Words
on the contrary
, they spent a minimum on videos for 1%. The allocations on electric equipment and musicLinking Words