
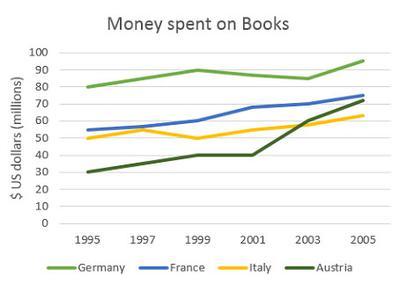
The line graph describes the number of people buying books in a decade from 1995 to 2005 in four countries (Germany, France, Italy, and
Austria
). The data is measured in millions of US dollars.
Use synonyms
Overall
, all nations experienced gradual increments over the Linking Words
year
with Germany spending money on books the most. Meanwhile, Use synonyms
Austria
with the least sales in the former Use synonyms
year
managed to surpass Italy and placed third by the end.
Use synonyms
Firstly
, Germany spent around 80 Linking Words
million
dollars in 1995 and increased steadily until 1999 with approximately 90. Use synonyms
However
, it fell slightly to about more than 80 but Linking Words
then
quickly recovered and hit a peak of less than 100 in 2005. Linking Words
In addition
, France citizen was setting aside their money rapidly to buy books which were noticed by sky rocketed trendline from more than 50 in 1995 to higher than 70 in 2005.
Another unique point is that Italy experienced a fluctuating trendline from the Linking Words
year
1995 to 1999 which started from around 50 Use synonyms
million
but Use synonyms
then
had the same figures in the latter Linking Words
year
. Use synonyms
On the other hand
, Linking Words
Austria
managed to have an upward trend starting with 30 Use synonyms
million
in 1995 and having a 10 Use synonyms
million
higher number in 1999 which was followed by a period of stability. In 2003, Use synonyms
Austria
surpassed the Italy trendline and reached its highest point of slightly more than 70 Use synonyms
million
in 2005.Use synonyms