
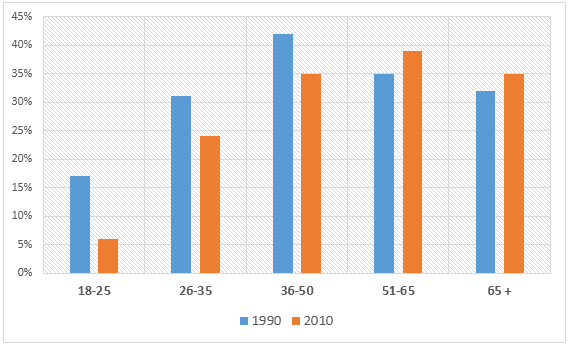
The given bar graph compares the proportion of
donations
contributed by different Use synonyms
age
categories of Britishers in the years 1990 and 2010.
Use synonyms
Overall
, it is evident that Linking Words
age
groups between 36-50 are found to be the highest donors of Use synonyms
charity
among different demographics of British people. Use synonyms
Whereas
, the lowest Linking Words
donations
are devoted to Use synonyms
charity
purposes by the Use synonyms
age
of 18-65.
Clearly from the chart, the number of Use synonyms
donations
put in by British folks increased drastically from the Use synonyms
age
18 to 50 years of individuals in the year 1990,Use synonyms
Linking Words
however
the Add a comma
,however
age
Use synonyms
group
26-35 assisted the Use synonyms
charity
by 33% which is promptly more than the Use synonyms
charity
by Use synonyms
age
Use synonyms
group
18-25. Use synonyms
While
the Linking Words
age
Use synonyms
group
36-50 was the highest debtors of Use synonyms
charity
in 1990 than in 2010 which was 42% and 35% respectively. Surprisingly, the Use synonyms
age
Use synonyms
group
51-65 and 65+ have almost the same inclination to put Use synonyms
donations
towardsUse synonyms
Add an article
a
the
charity
of roughly around 35% in both years.
Use synonyms
To conclude
, the Linking Words
age
categories who are more insisted to denote money are under 50 and after that, the statistics showed constant Use synonyms
donations
.Use synonyms