
Essay type:
Pie
chart 📉
The two Use synonyms
pie
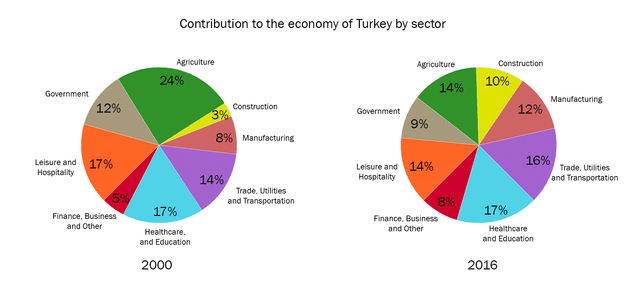
charts 📈 illustrate 8 categories of Use synonyms
Turkey
's means (agriculture, Transportation, Healthcare and education, Finance, Business and others , Leisure and Hospitality, and government) over the period of 16 years
It is noticeable that the proportion of using agriculture and Leisure and Hospitality experienced a considerable lower between 2000 and 2016, Use synonyms
while
the figure for construction and Trade, Utilities and Transportation power saw an arm.
In 2000,24% of the average, Linking Words
Turkey
's economy went into agriculture which was the largest Use synonyms
pie
graph. But, by 2016 Use synonyms
this
figure had fallen by one in ten.
During the given period, the demand for Leisure and Hospitality in Linking Words
Turkey
experienced a 3 per cent decrease from 17% to 14%.
Use synonyms
By contrast
, in terms of Trade, Utilitea and Transportation the proportion of help in Linking Words
this
category made up 14% in 2000, after sixteen years Linking Words
this
figure saw an increase at 16 per cent making larger sectors on the sketch 📈.
In Linking Words
Turkey
country, the smallest proportion belonged to construction in the first 🥇 year, Use synonyms
however
, in 2016, there was a 7% rise from 3% to 10% in Linking Words
this
category by overtaking finance, business and other government sectors.
The only unchanged sector in the given Linking Words
pie
chart 📉 is Healthcare and Education which maintained its rate over the period accounting 🧾 for 17%.Use synonyms