The charts below show the proportions of the wor/d's oíl resources he/d in different areas, together with the proportions consumed annually in the same areas. Summarise the information by se/ecting and reporting the main features, and make comparisons where relevant.

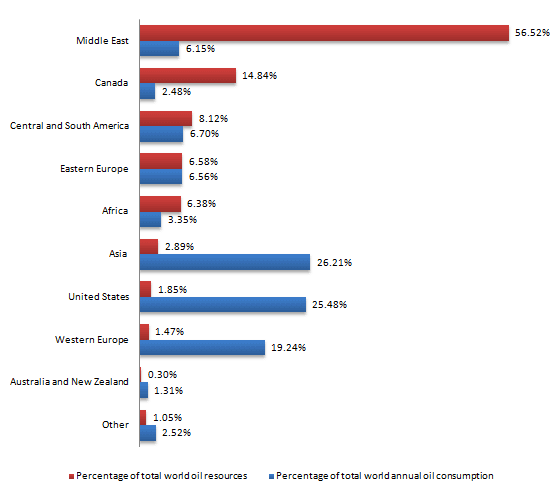
These two charts show the percentage of total world oil resources and the percentage of total world oil consumption per year.
Overall
, we observe that the areas which produce more petrol, do not have the biggest consumption and on the contrary
, the countries that consume more, have a
little production. Correct article usage
apply
Firstly
, we see that the Middle East is the main source of petrol, they make more than half. Secondly
, Canada follows the lead, with a production of 14,84%. Canada and the Middle East have only an oil consumption of 6,15% and 2,48% respectively. Thirdly
, we observe which are the areas with high numbers. Asia and the United States consume a quarter of this
resource in the world each one. Western Europe absorbs 19,24%, the third zone with the highest figures. Finally
, if we pay attention to their capacity of made petrol we see that they produce less than 3% of it.Submitted by santos_dij on
Unauthorized use and/or duplication of this material without express and written permission from this site’s author and/or owner is strictly prohibited. Excerpts and links may be used, provided that full and clear credit is given to Writing9 with appropriate and specific direction to the original content.
Conclusion: The conclusion is too long.
Basic structure: Write more paragraphs.
▼
Basic structure: Add more body paragraphs.
▼
Basic structure: Write more paragraphs.
▼
Vocabulary: Rephrase the word "show" in your introduction.
▼
Vocabulary: Only 4 basic words for charts were used.
▼
Vocabulary: The word "percentage" was used 2 times.
▼