
Presented line graphs depict some information, which connected with
amount
of people who uses train as a vehicle in Sydney city in Use synonyms
period
from 2000 to 2009 and actual "punctuality" of these trains in the same Use synonyms
period
of time.
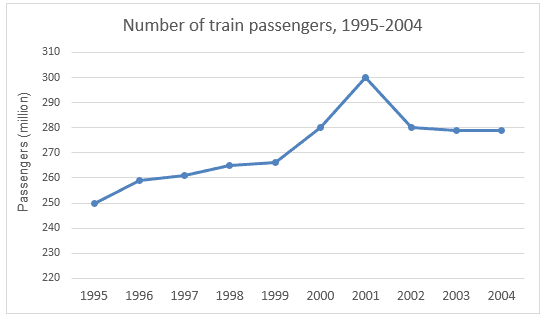
The first graph demonstrates unrapid changes in number of passanger: from 2000 to 2003 years the number stays approximatelly the same, 40 millions of people, but next there can be seen some deacreasing, and after that Use synonyms
amount
of passangers reaches the maxsimum in 2005, more than 45 millions people uses train. Eventually, the next 4 years present some stability. So, during the whole Use synonyms
period
the Use synonyms
amount
of passangers never becomes bigger than 45 millions.
The second graphs represents Use synonyms
amount
of trains, which are in time. But, unfortunatelly, the half of all given Use synonyms
period
tarins don't come right at time: from 2000 to 2002 we can see Use synonyms
such
picture, but from 2002 to 2005 significant Linking Words
amount
of trains make its job well, what can be explained by rising Use synonyms
amount
of train users in that Use synonyms
period
. After 2005 the percenatge of trainse decraeses again, and riches its maximum only after 2008. So, Use synonyms
then
persentage stays unchangable till the end of the persented Linking Words
period
.Use synonyms