The table data shows the proportion of income adults and children spent on 4 common items in the United Kingdom in 2005. Summarise the information by selecting and reporting the main features, and make comparisons where relevant.

The table data shows the proportion of income adults and children spent on 4 common items in the United Kingdom in 2005. Summarise the information by selecting and reporting the main features, and make comparisons where relevant.
IELTS Writing Task Chart for The table data shows the proportion of income adults and children spent on 4 common items in the United Kingdom in 2005. Summarise the information by selecting and reporting the main features, and make comparisons where relevant.
✨ Do you want to improve your IELTS writing?
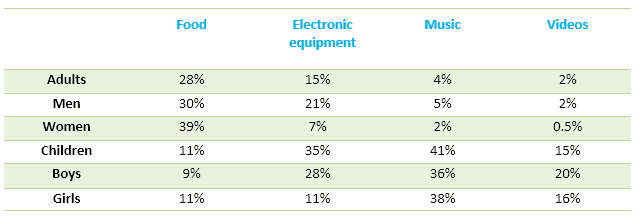
The table illustrates the proportion of common
items
Use synonyms
between adults and children in the Uk in 1998.
Overall
Linking Words
the category of the common item that all
ages
Use synonyms
spent the most on food was two times higher than the other types of
items
Use synonyms
. The lowest spending could be seen in the category of videos in all six
ages
Use synonyms
. The outlay of children was generally higher than other 4
ages
Use synonyms
. In terms of food, women spend the most at 39%. The consumer among the adults was
also
Linking Words
high (25%) compared to boys who spend less than other
ages
Use synonyms
. Men children and girls spend 14% 10% and 11%.
On the other hand
Linking Words
, the lowest spending item is videos for under 20% of all
ages
Use synonyms
. Boys spent most of these
items
Use synonyms
at just 18% and
that is
Linking Words
more than double that of women (0.5). Music and electronic equipment were in the medal category of spending outlays for these two
items
Use synonyms
were between 23% for the electronic equipment and 40% for the music. The
ages
Use synonyms
of the UK spending averaged around 1% for electronic equipment and around 0.5 for videos.

Unauthorized use and/or duplication of this material without express and written permission from this site's author and/or owner is strictly prohibited. Excerpts and links may be used, provided that full and clear credit is given to Writing9 with appropriate and specific direction to the original content.

Vocabulary: Replace the words items, ages with synonyms.
Vocabulary: Only 5 basic words for charts were used.
Vocabulary: The word "around" was used 2 times.
Vocabulary: Use several vocabularies to present the data in the second paragraph.
Topic Vocabulary:
  • proportion of income
  • spending habits
  • significant differences
  • trends
  • necessity
  • preference
  • lifestyle
  • expenditure
  • allocate
  • consumer behavior
  • contrast
  • notably
  • on the other hand
  • account for
  • percentage of income
What to do next:
Look at other essays: