
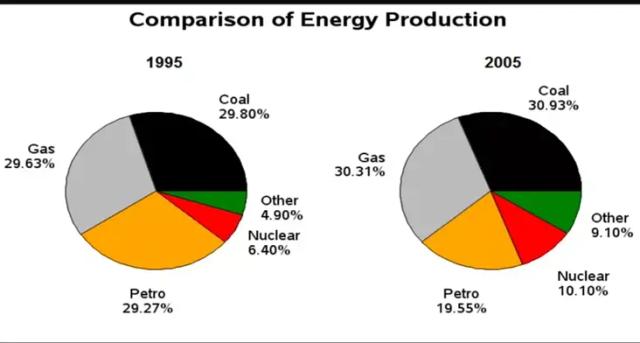
The diagram compares several types of
energy
production in France in 1995 and Use synonyms
in
2005. There are coal, nuclear, Change preposition
apply
gas
, Use synonyms
petro
and other kinds.
The two charts reveal that Correct your spelling
petrol
gas
stood in the greatest proportion in both 1995 and 2005. Use synonyms
Although
other kinds of Linking Words
energy
production bore the least parts, the expansion was raised from 4.9% to 9.1%. The production of coal , Use synonyms
gas
and nuclear slightly increased in 2005. Coal Use synonyms
energy
grew from 29.8% to 30.93%. Use synonyms
Gas
Use synonyms
energy
rose from 29.63% to 30.31%. Nuclear power expanded from 6.4% to 10.1%.Use synonyms
On the other hand
, Linking Words
petro
had an obvious reduction from 29.27% to 19.55%.
We can tell from the pie charts that Change the capitalization
Petro
gas
played an important role Use synonyms
due to
the high and rising proportion. Linking Words
However
, the decrease Linking Words
of
petro not only indicated that it was less productive but Change preposition
in
also
showed that the use of the rest categories enhanced in a decade.Linking Words