The table below shows the proportion of different categories of families living in poverty in Australia in 1999. Summarize the information by selecting and reporting the main features, and make comparisons where relevant.

The table below shows the proportion of different categories of families living in poverty in Australia in 1999. Summarize the information by selecting and reporting the main features, and make comparisons where relevant.
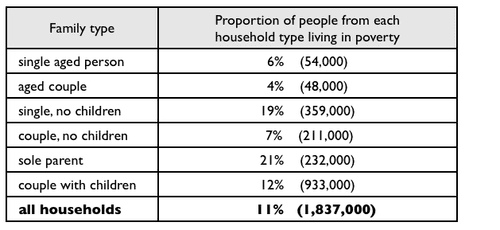
The following table demonstrates the dissimilarities in the levels of poverty of different family types in Australia in 1999.
Overall
, young families with
children
were more likely to be poor than households with elderly members, except for the single without
children
type. Regarding the three major categories,
whereas
Correct word choice
apply
show examples
the poverty rate was the highest among homes with only one primary carer, at 21%, followed by a 2% lower group of single individuals without sons or daughters, at 19%.
By contrast
, 12% of couples with
children
were classed as poor, ranking third in the table. In terms of the remaining categories,
single aged
Add a hyphen
single-aged
show examples
persons and elderly couples made up 6% and 4%, respectively of the Australian total rates of poor households, considered as the least likely to live below the poverty line, as opposed to pairs with
children
, at 7%.
Lastly
, all households which live in impoverishment in Australia accounted for 11%.
Submitted by ktebaeplease on

Unauthorized use and/or duplication of this material without express and written permission from this site’s author and/or owner is strictly prohibited. Excerpts and links may be used, provided that full and clear credit is given to Writing9 with appropriate and specific direction to the original content.

Introduction: The introduction is missing.
Introduction: Change the first sentence in the introduction.
Introduction: The chart intro is missing.
Basic structure: Change the fourth paragraph.
Introduction: The chart intro is missing.
Vocabulary: Replace the words children with synonyms.
Vocabulary: Only 1 basic words for charts were used.
Vocabulary: The word "table" was used 2 times.
Vocabulary: Use several vocabularies to present the data in the second paragraph.
Vocabulary: Use several vocabularies to present the data in the fourth paragraph.
What to do next:
Look at other essays: