
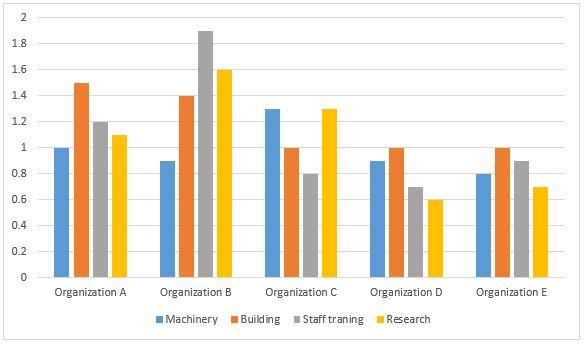
The given chart highlights information about the array of cash which was invested in five companies in four elements in 2015.
Overall
, it can be seen that Linking Words
the
swarm Correct article usage
apply
B
had the highest amount in three factors Use synonyms
instead
of Machinery Linking Words
while
the organization Linking Words
C
invested in Use synonyms
this
factor as much as other groups.
Looking at the details, the amount of money which was spent on Staff training was under two which was related to Linking Words
B
and it was followed by A with 1.2 Use synonyms
percentages
and Replace the word
per cent
then
with E and Linking Words
C
respectively and Use synonyms
finally
, the lowest quantity at company D with over 0.6 If we look at Building, it experienced a steady decrease in swarms A and Linking Words
B
in turn Use synonyms
whereas
Interestingly the bundles Linking Words
C
, D and E had exactly the similar quantity one.
As for Machinery, Use synonyms
the
group Correct article usage
apply
C
was on the head with 1.2 but others had similar amounts from 0.8 to 1. Regarding Research, it was ranked above others with 1.6 in the company Use synonyms
B
and again it was followed Use synonyms
with
Change preposition
by
C
and A with 1.3 and 1.1 respectively. The groups D Use synonyms
as well as
E had the lowest measures around 0.6 Linking Words
subsequently
.Linking Words