
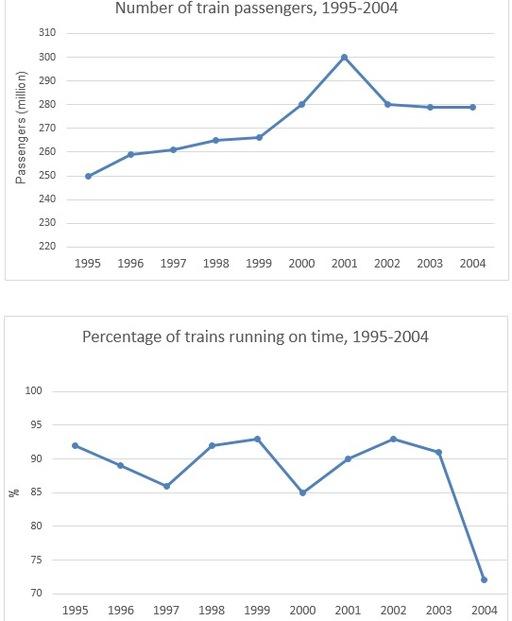
The provided line charts
depicts
how many passengers commuted by rail in Sydney and the proportion of Change the verb form
depict
trains
Use synonyms
departed
punctually during the period from 1994 and 2004.
Upon initial observation, it is clear Correct pronoun usage
that departed
from
that there was Change preposition
apply
a
upward tendency throughout the era in the number of commuters, simultaneously, the opposite was true for the percentage of Change the article
an
trains
running on Use synonyms
time
.
According Use synonyms
what
is given, as it can be seen, the Change preposition
to what
overall
sum of train passengers accounted for 250 Linking Words
million
in 1995, ergo, over the next four years, the statistics reached just under 270 Use synonyms
million
and increasedUse synonyms
a
peak of 300 Change preposition
to a
million
folks in 2001. Use synonyms
However
, the total amount of individuals using a railway diminished dramatically to 280 Linking Words
million
in 2002Use synonyms
,
Correct word choice
and, consequently
consequently
, followed a static Linking Words
trand
until 2004.
Regarding Correct your spelling
trend
to
the second graph, it is indisputable that the graph had frequent fluctuations during Remove the preposition
apply
this
Linking Words
time
Use synonyms
by
starting with the number of 92% Change preposition
apply
Use synonyms
trains
starting on Change preposition
of trains
time
in 1995. Within the five Use synonyms
years
the graph experienced oscillations, but the total of punctual departures Add a comma
,years
clibed
again to the initial point in 2002. Correct your spelling
climbed
Nevertheless
, the proportion of Linking Words
trains
which followed the Use synonyms
pinctual
Correct your spelling
punctual
time
dropped sharply to the lowest point of 72% in 2004.Use synonyms