
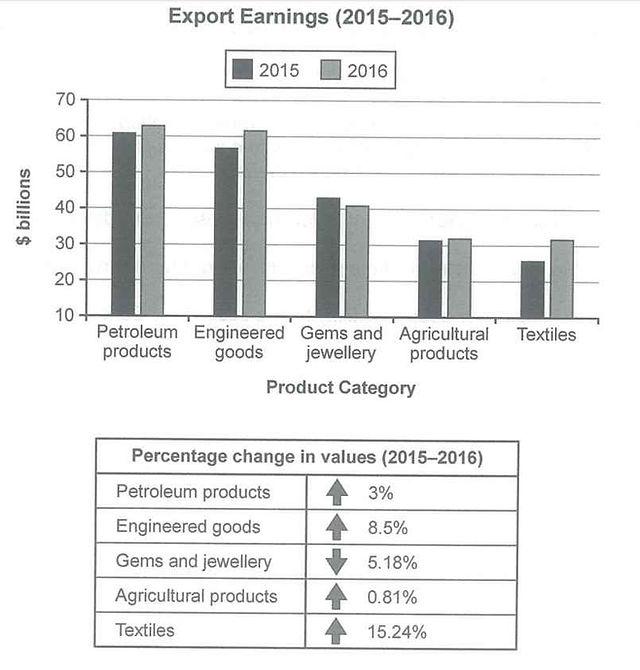
The bar chart provides information about how much earnings from the export activity of a country
while
the table illustrates the proportion of change in values from 2015 to 2016.
Linking Words
Overall
, it is obvious that petroleum Linking Words
products
took up the highest value. Meanwhile, textiles experienced the most impressive growth during the mentioned period.
Let's begin with the bar chart, placed top of the list was petroleum Use synonyms
products
, at over 60 billion in both 2015 and 2016, followed closely by engineered goods, at around 57 and 62 billion respectively. Gem and jewellery ranked in the third position, which accounted for approximately 41 and 44 in turn. About 31 billion agricultural Use synonyms
products
were exported in 2015, which was nearly equal to Use synonyms
this
figure one year later. The bottom of the list was clothing Linking Words
products
, made up of over 25 and 31 within 2 years.
As for the table, textiles headed the list with 15.24%, which was almost threefold higher than that of gems and jewellery (5.18%), and over five times higher than the figure for petroleum (3%). The lowest percentage of change in values belonged to agriculture, at only 0.81%, which is nowhere as high as engineering (8.5%).Use synonyms