
The pie charts illustrate the relation of various types of
energy
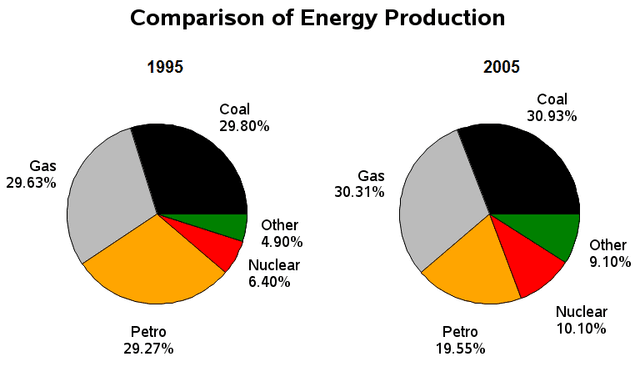
utilization in the UK for 1995 and 2005.
Use synonyms
Overall
, the most significant finding in the charts is that coal was the primary source of usable Linking Words
energy
in both 1995 and 2005.
In 1995, the production of Petro, Gas and Coal were their most famous usage with values of 29,27%, 29,63% and 29.80% respectively. The perspectives with the low proportions of Use synonyms
energy
were Nuclear and Others with numbers of 6.40% and 4.90%. Have the smallest amount of percentage rather than the other three energies.
In 2005, we do not have a lot of differences from the 1995 year compared to the total results. Coal , Gas and Petro are the most usable options with the amount of percentages 30.39% , 30.31% and 19.55% respectively. The Use synonyms
energy
consumption with the lowest quantity of usage was again Nuclear and Other with the accurate values of 10.10% and 9.10%Use synonyms