
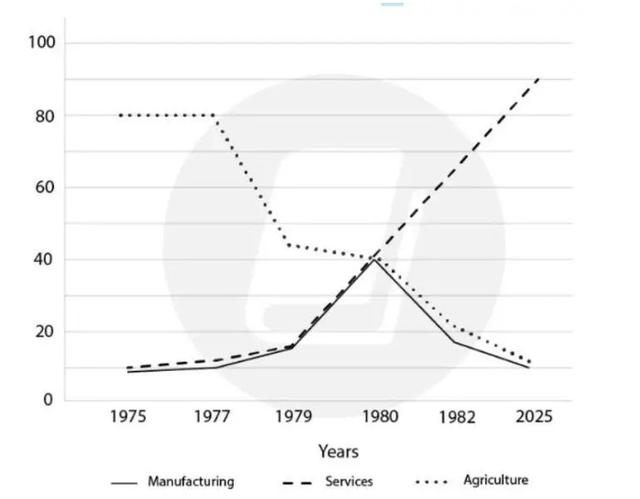
The line chart describes the challenges of employment in America from 1975 to 2025 .
Overall
, the service rich pick during the period . Linking Words
while
manufacturing rises in the three years after that it will be decreased .Linking Words
however
,agriculture fell down employments over the years.
From 1975 to 1979, Other service industries witnessed a slight decrease of approximately 5% over the same period. the work service in the US dramatically climbed by nearly 18 % .Equally , the manufacturing employees increased by almost 18% .Linking Words
nevertheless
,the agriculture level out by 80% . Linking Words
on the other hand
, it feels faster around 43% during the years .
From 1980 to 2025 , the manufacturing was in high puck 40 % . though it dropped rapidly by 10% .whilst , Agriculture was a downward trend by 40 and quickly plunge by 10% in 2025 . Linking Words
While
that services increased significantly by 90% in 2025 .Linking Words