
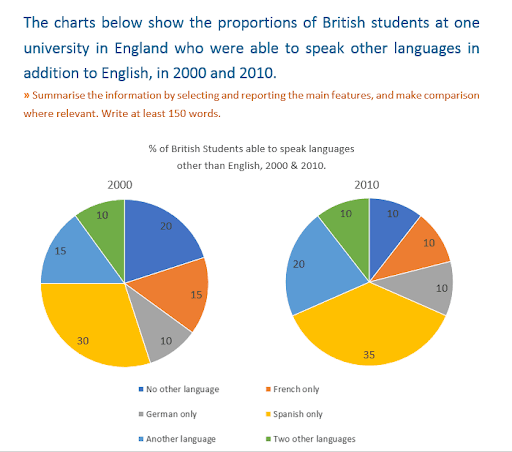
The pie charts illustrate the percentages of British Students in one university located in England who can speak other
languages
than English in 2021 and 2010. The Use synonyms
languages
are categorized into six groups.(french only, German only, Use synonyms
Spanish
only, another language, two other Use synonyms
languages
and no other Use synonyms
languages
)
Use synonyms
Overall
, the Linking Words
students
who Correct quantifier usage
number of students
is
able to speak other Change the verb form
are
languages
increased. The most spoken language was Use synonyms
Spanish
in 2000 and it protected its dominance in 2010.
The number of people who can speak Use synonyms
Spanish
, another and two other Use synonyms
languages
was 30%, 15% and 10%, respectively in 2020. All three of them increased their proportions by 5%. Use synonyms
While
Linking Words
Spanish
protected its dominance with 35 % another and two other language categories became the second and third largest categories with proportions of 20% and 15%, respectively in 2010.
Among those who can speak other Use synonyms
languages
, the only category that decreased by 15% to 10% in 2010 was French. The category of German only protects its proportion of 10%.Use synonyms