
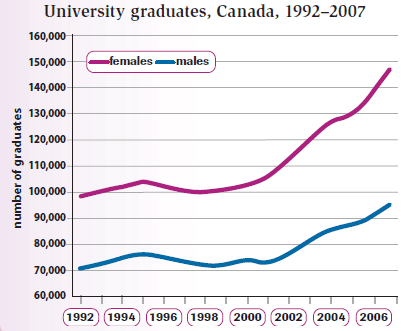
Looking at the
graph
given we are able to decipher that it shows the Use synonyms
number
of university Use synonyms
graduates
in Canada from 1992 to 2007. Use synonyms
This
is Linking Words
further
divided into Linking Words
males
and Use synonyms
females
which can be seen by looking at the key.
Glancing at the Use synonyms
graph
it is clearly visible that the Use synonyms
number
of Use synonyms
graduates
for both Use synonyms
males
and Use synonyms
females
Use synonyms
have
grown to reach their Change the verb form
has
peaks
in 2007. In the year 1992, when the Fix the agreement mistake
peak
graph
began recording the data the Use synonyms
number
of female Use synonyms
graduates
was 100,000 Use synonyms
whereas
the Linking Words
males
were at 70,000. Use synonyms
This
shows that there were always more female Linking Words
graduates
in Canada by 30,000. Use synonyms
However
, as the years continued Linking Words
this
gap became even more evident as in 2007, the difference between the two was around 34,000.
Taking a better look at the Linking Words
graph
, we can see that there were a lot of fluctuations in the numbers especially for the Use synonyms
females
. In the year 1994, the Use synonyms
number
stopped growing but Use synonyms
instead
, dipped back down to around 100,000 again. Linking Words
This
went on till 2001 Linking Words
where
Rephrase
when
then
it began to grow again at a much steeper rate. During the years leading up to Linking Words
2002
there were 20,000 more Add a comma
,2002
graduates
which was the fastest growth recorded between both Use synonyms
females
and Use synonyms
males
. Use synonyms
Then
, Linking Words
this
slowed down in 2004 Linking Words
where
the Correct word choice
when
number
stagnated at just below 130,000. Use synonyms
After
Linking Words
this
, like before, the Linking Words
amount
of female Change the quantifier
number
graduates
started to rapidly increase again reaching Use synonyms
the
peak in 2007 as mentioned before.
Moving on to the male Correct article usage
a
graduates
it is visible that there are Use synonyms
less
fluctuations and it is more steady. There is an almost identical rise and dip as described for the Change the quantifier
fewer
females
from 1994 to 1999. Use synonyms
Then
, between Linking Words
then
and 2000 there was a small rise by around 15,000 Linking Words
however
, Linking Words
that is
shortlived as in 2001 it Linking Words
plummited
again. Correct your spelling
plummeted
After
Linking Words
this
came the biggest rise there was for male Linking Words
graduates
yet. Like the female Use synonyms
graduates
it lasted from 2002 till 2004 after which it started to slow down Use synonyms
unlike
the Add the comma(s)
,unlike
females
who continued to increase.Use synonyms