
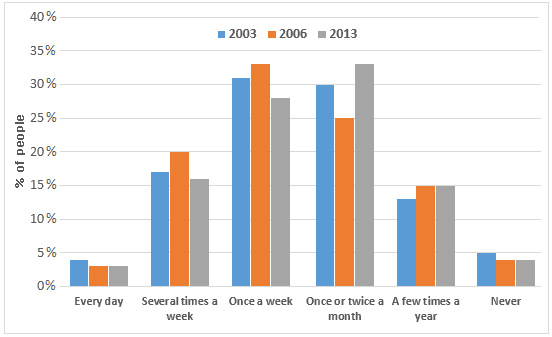
The provided line graphs
expresses
the volume of the fast food eater frequency in the restaurants of the United States of America from the Change the verb form
express
year
2003 to Use synonyms
year
2013.
Use synonyms
Overall
, Linking Words
Correct article usage
the pertcentage
pertcentage
of Correct your spelling
percentage
the
people Correct article usage
apply
in
Change preposition
at
diffenent
Correct your spelling
different
Use synonyms
time
of the Fix the agreement mistake
times
month
Use synonyms
are
described here. Change the verb form
is
Where
, in the Rephrase
apply
Use synonyms
year
2003, 2006, and Fix the agreement mistake
years
year
2013 most of the people visited Use synonyms
Use synonyms
cafe
once a Fix the agreement mistake
cafes
week
and once or twice a Use synonyms
month
Use synonyms
most
.
Correct quantifier usage
apply
First,
in the age Linking Words
2003
, most of the Change preposition
of 2003
time
Use synonyms
cizitizens
were had been to Correct your spelling
citizens
Use synonyms
cafe
once a Correct article usage
a cafe
week
(31%) or once or twice a Use synonyms
month
(30%). After that 17% Use synonyms
Change preposition
of male
male
Fix the agreement mistake
males
or
Correct word choice
and
female
Fix the agreement mistake
females
vistied
hotels for the Correct your spelling
visited
purposes
of eating several Fix the agreement mistake
purpose
times
a Use synonyms
week
. Minimum Use synonyms
vistiors
noticed Correct your spelling
visitors
in-
Correct your spelling
in
everyday
, a few Replace the word
every day
times
a Use synonyms
year
and never each Use synonyms
time
Use synonyms
vistitor's
rate was less than 15%.
Correct your spelling
visitor's
visitors
Second,
in the Linking Words
year
2006, Use synonyms
Maximum
people visited restaurants once a Correct word choice
Most
week
or once or twice a Use synonyms
month
like Use synonyms
2003
and 2013. The ratio was more than 30% in Change preposition
in 2003
Linking Words
Correct determiner usage
these
this
two categories. Followed by Fix the agreement mistake
these
these two genre
, Change the determiner
this two genre
these two genres
several
Correct article usage
the several
times
a Use synonyms
week
category got Use synonyms
most
clients. The consumer rate was 20% which was more than Correct article usage
the most
other
two years.
Correct article usage
the other
Finally
, in the Linking Words
year
2013 maximum number of clients spent Use synonyms
time
in the Use synonyms
cafe
once or twice a Use synonyms
month
. The percentage was nearly 33%. Use synonyms
This
is the highest among other categories. Linking Words
Linking Words
This
period, Change preposition
During this
less consumer
spent Fix the agreement mistake
fewer consumers
cafe
in Use synonyms
everyday
category(2.5%), a few Correct article usage
the everyday
times
a Use synonyms
year
(15%), and never (4%), which are equal to the Use synonyms
year
2006.Use synonyms