
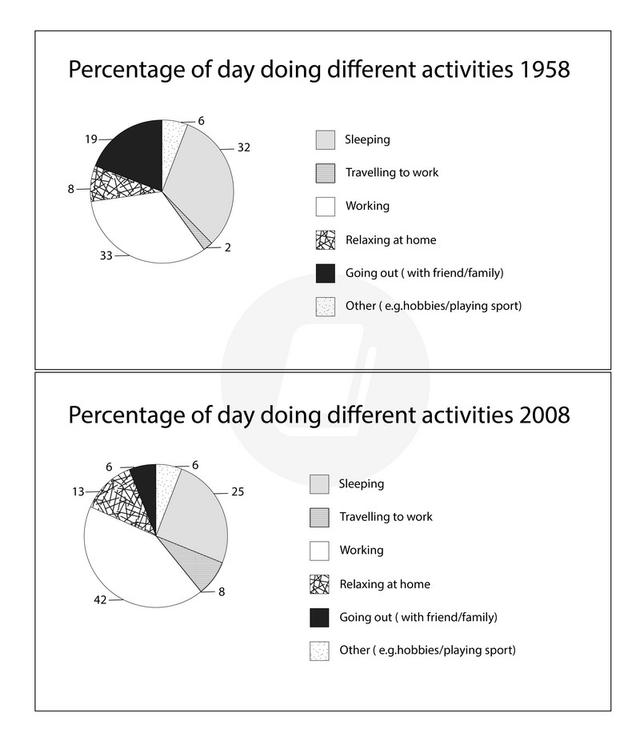
The provided pie charts illustrate the distribution of time allocated by employed adults to various activities in a specific country during two separate years , 1958 and 2008 .
The number of sleeping is decreased by 7 percent ( 32% to 25%) . The significant falling percentage of activity over 50 years in adults is going out with acquaintances , from 19 to 6 per cent.
By contrast
, the trend of relaxing at home has increased . In 1958 Linking Words
this
number was 8 % but after fifteen years it became 13 % .
The most growth was observed in working activity by 9 units ( 33 % to 42 % ) . Linking Words
Also
, travel to work quadrupled by the amount in a half-century. In the Linking Words
last
50s started at 2 % and culminated at 8 % . Linking Words
Likewise
, playing sports or other interests increased from 6 % to 8 % and correlation became equal with travel to work .
Looking from an Linking Words
overall
perspective , 2 activities increased and 4 decreased for 5 decades . Working was like practice among grown people. Linking Words
In addition
the unpopular was travel between 1958 to 2008 .Linking Words