
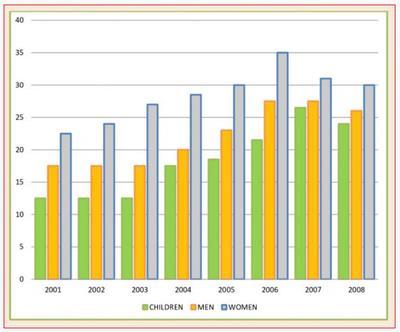
The bar graph depicts how the data on the proportion of people who consumed five different parts of
fruits
and Use synonyms
vegetables
on a regular day changed over an eight-year period, starting from 2001.
Use synonyms
Overall
it can be seen that women ate Linking Words
consequently
the maximum percentage of Linking Words
fruits
and Use synonyms
vegetables
per day compared to the kids and male person. Use synonyms
Furthermore
, children showed always the lowest value for berries and edible herbs consumption.
Looking at the female information set in detail Linking Words
it is clear that
daily usage of berries and Linking Words
vegetables
stood at approximately 23% in 2001 which increased gradually to 30% in 2005. By 2006, the amount had risen to 35% which represents the highest evidence among all of them. After that, the rate of eating Use synonyms
such
commodities decreased Linking Words
consequently
to 30% in 2008.
Turning to the kids and male info sets in detail it is evident that the number remained constant for offspring and mankind accounting for nearly 13% until 2003. For early-aged citizens, taking daily root Linking Words
vegetables
and Use synonyms
fruits
little by little increased from 17% in 2004 to 26% in 2007. In 2008, the consumption % slightly dropped to 24% for offspring. Use synonyms
Also
, the figure represents for female participants 20% of edible herbs and Linking Words
fruits
in 2004 grew sharply up to 2006 accounting for 27%, and remained the same up to 2007. Use synonyms
Finally
, the figure fell slowly to 26% in 2008.Linking Words