
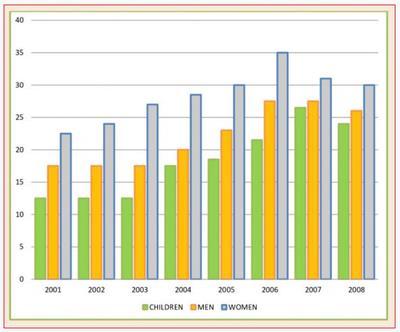
The graph provides information about the number of societies that can eat fruit and vegetables in the UK over a seven-year period.
Overall
, Linking Words
according to
the table, there are three types of people who consume Linking Words
this
meal, from a young and an adult age.
Linking Words
To begin
, the first number of women who loved salad and vegan in the time of 2001 was 21%. After that, the score slightly reached a peak of score in the moment of 2006 which is 35%. Linking Words
However
, Linking Words
this
count fell in the Linking Words
last
two periods to 30%.
Linking Words
Furthermore
, the ratio of children obsessed with fruit and vegetables rose to 26% in the 2007 term, suddenly down again by 25% in the next year. But, compared to six years before under 25% proportion. Linking Words
On the other hand
, the data show Linking Words
28
% of men eat Correct word choice
that 28
this
meal in the first three years. The rate of male consumption grew gradually by 28% at the same time which was between 2006 and 2007.Linking Words